

Multivariate random effects meta-analysis of diagnostic tests with multiple thresholds
- PMID: 19903336
- PMCID: PMC2787531
- DOI: 10.1186/1471-2288-9-73
Multivariate random effects meta-analysis of diagnostic tests with multiple thresholds
Abstract
Background: Bivariate random effects meta-analysis of diagnostic tests is becoming a well established approach when studies present one two-by-two table or one pair of sensitivity and specificity. When studies present multiple thresholds for test positivity, usually meta-analysts reduce the data to a two-by-two table or take one threshold value at a time and apply the well developed meta-analytic approaches. However, this approach does not fully exploit the data.
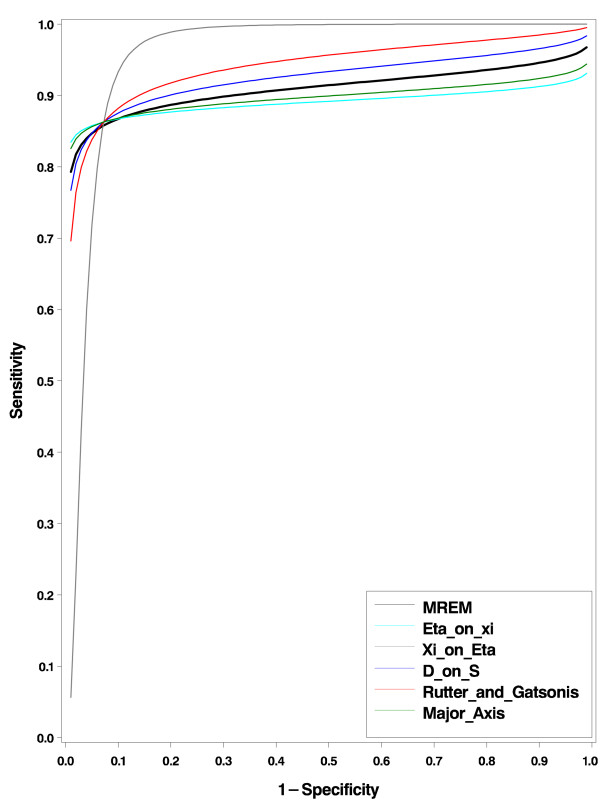
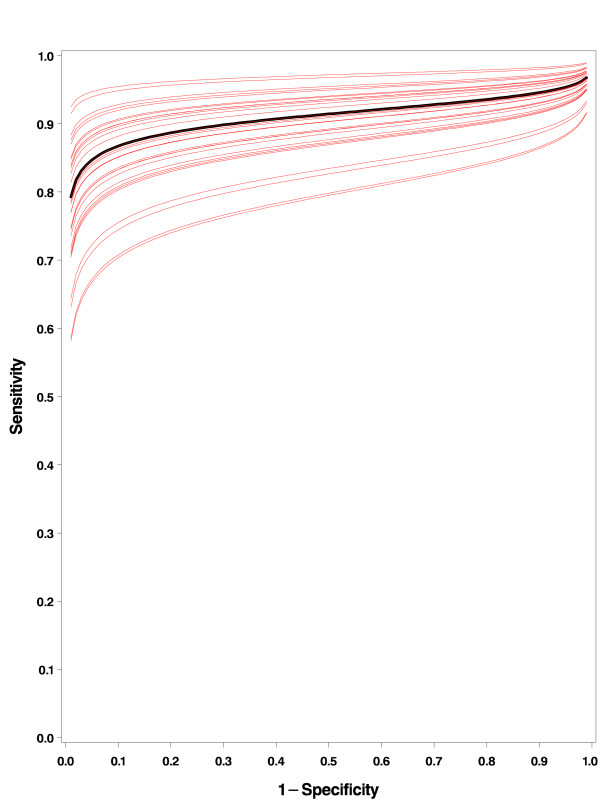
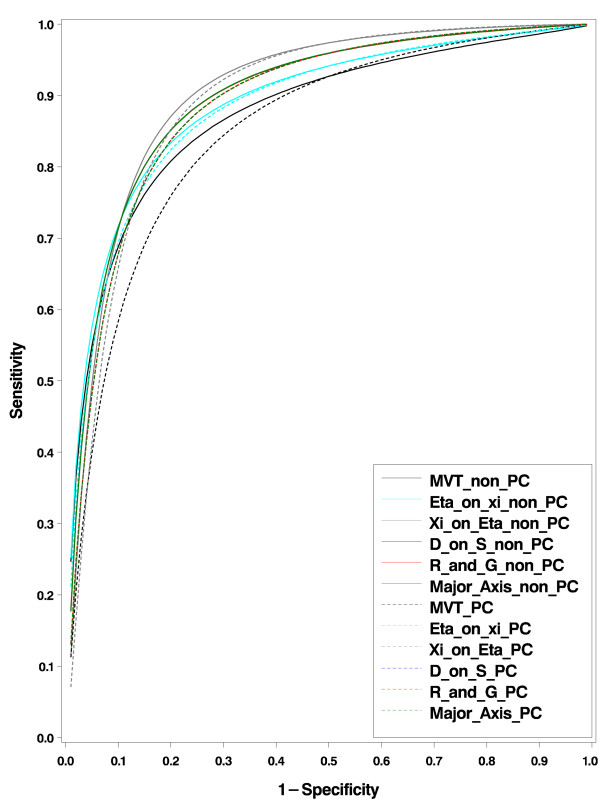
Methods: In this paper we generalize the bivariate random effects approach to the situation where test results are presented with k thresholds for test positivity, resulting in a 2 by (k+1) table per study. The model can be fitted with standard likelihood procedures in statistical packages such as SAS (Proc NLMIXED). We follow a multivariate random effects approach; i.e., we assume that each study estimates a study specific ROC curve that can be viewed as randomly sampled from the population of all ROC curves of such studies. In contrast to the bivariate case, where nothing can be said about the shape of study specific ROC curves without additional untestable assumptions, the multivariate model can be used to describe study specific ROC curves. The models are easily extended with study level covariates.
Results: The method is illustrated using published meta-analysis data. The SAS NLMIXED syntax is given in the appendix.
Conclusion: We conclude that the multivariate random effects meta-analysis approach is an appropriate and convenient framework to meta-analyse studies with multiple threshold without losing any information by dichotomizing the test results.
Figures
Similar articles
-
Bivariate random effects meta-analysis of ROC curves.Med Decis Making. 2008 Sep-Oct;28(5):621-38. doi: 10.1177/0272989X08319957. Epub 2008 Jun 30. Med Decis Making. 2008. PMID: 18591542
-
Empirical Bayes estimates generated in a hierarchical summary ROC analysis agreed closely with those of a full Bayesian analysis.J Clin Epidemiol. 2004 Sep;57(9):925-32. doi: 10.1016/j.jclinepi.2003.12.019. J Clin Epidemiol. 2004. PMID: 15504635
-
A comparison of bivariate, multivariate random-effects, and Poisson correlated gamma-frailty models to meta-analyze individual patient data of ordinal scale diagnostic tests.Biom J. 2017 Nov;59(6):1317-1338. doi: 10.1002/bimj.201600184. Epub 2017 Jul 10. Biom J. 2017. PMID: 28692782
-
Statistical methods for multivariate meta-analysis of diagnostic tests: An overview and tutorial.Stat Methods Med Res. 2016 Aug;25(4):1596-619. doi: 10.1177/0962280213492588. Epub 2013 Jun 26. Stat Methods Med Res. 2016. PMID: 23804970 Free PMC article. Review.
-
Bivariate analysis of sensitivity and specificity produces informative summary measures in diagnostic reviews.J Clin Epidemiol. 2005 Oct;58(10):982-90. doi: 10.1016/j.jclinepi.2005.02.022. J Clin Epidemiol. 2005. PMID: 16168343 Review.
Cited by
-
Clinical utility of arterial spin labeling for preoperative grading of glioma.Biosci Rep. 2018 Aug 31;38(4):BSR20180507. doi: 10.1042/BSR20180507. Print 2018 Aug 31. Biosci Rep. 2018. PMID: 29769414 Free PMC article.
-
Clinical utility of decarboxylation prothrombin combined with α-fetoprotein for diagnosing primary hepatocellular carcinoma.Biosci Rep. 2018 Oct 5;38(5):BSR20180044. doi: 10.1042/BSR20180044. Print 2018 Oct 31. Biosci Rep. 2018. PMID: 29717027 Free PMC article.
-
Evaluation of the NMP22 BladderChek test for detecting bladder cancer: a systematic review and meta-analysis.Oncotarget. 2017 Oct 23;8(59):100648-100656. doi: 10.18632/oncotarget.22065. eCollection 2017 Nov 21. Oncotarget. 2017. PMID: 29246009 Free PMC article.
-
Comprehensive analysis on diagnostic value of circulating miRNAs for patients with ovarian cancer.Oncotarget. 2017 May 24;8(39):66620-66628. doi: 10.18632/oncotarget.18129. eCollection 2017 Sep 12. Oncotarget. 2017. PMID: 29029542 Free PMC article. Review.
-
Multivariate meta-analysis: potential and promise.Stat Med. 2011 Sep 10;30(20):2481-98. doi: 10.1002/sim.4172. Epub 2011 Jan 26. Stat Med. 2011. PMID: 21268052 Free PMC article.
References
-
- Moses LE, Shapiro D, Littenberg B. Combining independent studies of a diagnostic test into a summary ROC curve: Data-analytic approaches and some additional considerations. Statistics in Medicine. 1993;12:1293–1316. - PubMed
Publication types
MeSH terms
LinkOut - more resources
Full Text Sources
