

doi: 10.1186/gb-2009-10-11-r128.
Epub 2009 Nov 11.
Genome Alteration Print (GAP): a tool to visualize and mine complex cancer genomic profiles obtained by SNP arrays
Affiliations
- PMID: 19903341
- PMCID: PMC2810663
- DOI: 10.1186/gb-2009-10-11-r128
Item in Clipboard
Genome Alteration Print (GAP): a tool to visualize and mine complex cancer genomic profiles obtained by SNP arrays
Genome Biol.
2009.
Abstract
We describe a method for automatic detection of absolute segmental copy numbers and genotype status in complex cancer genome profiles measured with single-nucleotide polymorphism (SNP) arrays. The method is based on pattern recognition of segmented and smoothed copy number and allelic imbalance profiles. Assignments were verified by DNA indexes of primary tumors and karyotypes of cell lines. The method performs well even for poor-quality data, low tumor content, and highly rearranged tumor genomes.
Figures
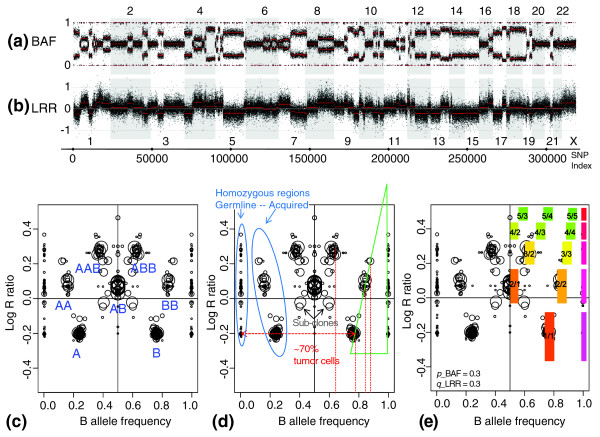
The whole-genome single-nucleotide polymorphism (SNP) array profile and genome alteration print (GAP). The whole-genome profile of genomic rearrangements in the BLC_B1_T45 sample measured by 300K Illumina SNP-array and corresponding GAP. (a) Allelic imbalances are represented by B-allele frequency (BAF). (b) Copy-number variation profile is represented by log R ratio (LRR), centered at zero. (c) The GAP of the sample is a combined sideview projection of segmented LRR and BAF. Each region of the genome is represented by two symmetric circles in the case of allelic imbalance and by one circle centered at BAF = 0.5 in the case of a balanced genotype. Attribution of copy numbers and genotypes corresponds to a near-diploid model of rearrangements. (d) "Reading" GAP pattern: the degree of stromal contamination, acquired and germline homozygosities, and subclones are indicated. (e) The best-fitting model GAP allows interpretation of the cluster structure and estimates contamination by normal DNA and contraction of the pattern on the LRR scale. Clusters are designated by the ratio of copy number to B (or major allele) counts.
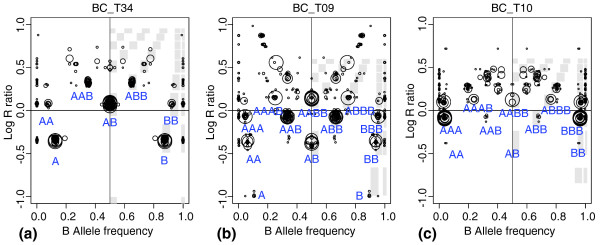
Characteristic genome alteration print (GAP) patterns. Two characteristic (a, b) and one unique (c) GAP patterns obtained in the analysis of a breast carcinoma series: (a) near-diploid pattern, sample BLC_ T34; (b) near-tetraploid pattern, sample BLC_T09; and (c) possible near-triploid pattern, sample BLC_T10. Attribution of genotypes is based on the type of pattern; best-fitting models are shown.
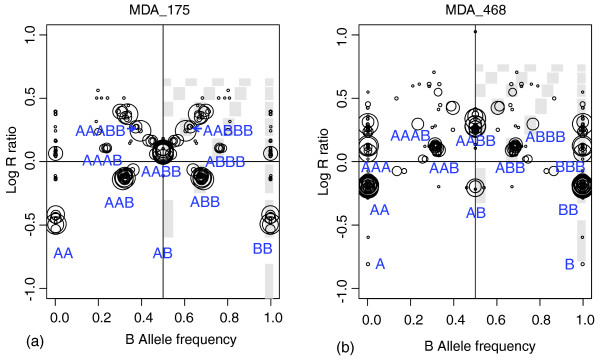
Genome alteration prints (GAPs) for breast cancer cell lines. GAPs for breast cancer cell lines: (a) MDA_175; and (b) MDA_468. Both GAPs show a near-tetraploid pattern, and genotypes were assigned accordingly.
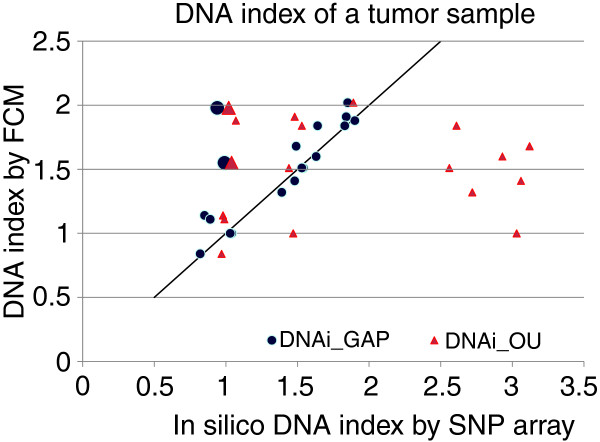
Comparison of genome alteration print (GAP) and OverUnder-based in silico DNA indexes with experimental DNA indexes. GAP indexes (blue circles) show excellent correspondence with experimental DNA indexes. OverUnder indexes (red triangles) show more outliers with overestimation of the DNA index. Both methods show consistent results, but not corresponding to the experimental DNA indexes (1.98 and 1.5) for two samples, designated by enlarged markers.
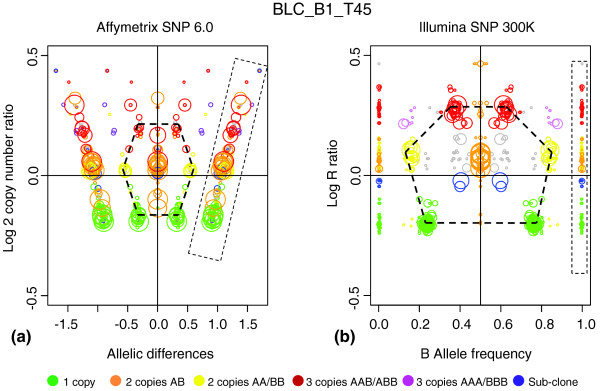
Genome alteration print (GAP) for Affymetrix single-nucleotide polymorphism (SNP) GeneChip SNP 6.0 array. BLC_B1_T45 tumor sample measured on two SNP-array platforms, analyzed by using GAP, and superimposed by color code: (a) GAP for Affymetrix; and (b) GAP for Illumina. Copy numbers obtained from the Illumina GAP were coded by colors indicated at the bottom of the Figure. Concordance between Affymetrix and Illumina patterns is illustrated by the relevant Illumina-derived color gradation on Affymetrix GAP. Germline homozygous regions are boxed. The main cluster patterns are indicated by hexagonal frames. The differences in relative cluster sizes are due to different distributions of SNPs measured along the genome in Illumina and Affymetrix chips.
References
-
- Chin K, DeVries S, Fridlyand J, Spellman PT, Roydasgupta R, Kuo WL, Lapuk A, Neve RM, Qian Z, Ryder T, Chen F, Feiler H, Tokuyasu T, Kingsley C, Dairkee S, Meng Z, Chew K, Pinkel D, Jain A, Ljung BM, Esserman L, Albertson DG, Waldman FM, Gray JW. Genomic and transcriptional aberrations linked to breast cancer pathophysiologies. Cancer Cell. 2006;10:529–541. doi: 10.1016/j.ccr.2006.10.009. - DOI - PubMed
Publication types
MeSH terms
LinkOut - more resources
Full Text Sources
Other Literature Sources
Medical
Molecular Biology Databases
Miscellaneous
