Altered serotonin physiology in human breast cancers favors paradoxical growth and cell survival
- PMID: 19903352
- PMCID: PMC2815543
- DOI: 10.1186/bcr2448
Altered serotonin physiology in human breast cancers favors paradoxical growth and cell survival
Abstract
Introduction: The breast microenvironment can either retard or accelerate the events associated with progression of latent cancers. However, the actions of local physiological mediators in the context of breast cancers are poorly understood. Serotonin (5-HT) is a critical local regulator of epithelial homeostasis in the breast and other organs. Herein, we report complex alterations in the intrinsic mammary gland serotonin system of human breast cancers.
Methods: Serotonin biosynthetic capacity was analyzed in human breast tumor tissue microarrays using immunohistochemistry for tryptophan hydroxylase 1 (TPH1). Serotonin receptors (5-HT1-7) were analyzed in human breast tumors using the Oncomine database. Serotonin receptor expression, signal transduction, and 5-HT effects on breast cancer cell phenotype were compared in non-transformed and transformed human breast cells.
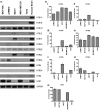
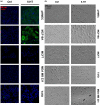
Results: In the context of the normal mammary gland, 5-HT acts as a physiological regulator of lactation and involution, in part by favoring growth arrest and cell death. This tightly regulated 5-HT system is subverted in multiple ways in human breast cancers. Specifically, TPH1 expression undergoes a non-linear change during progression, with increased expression during malignant progression. Correspondingly, the tightly regulated pattern of 5-HT receptors becomes dysregulated in human breast cancer cells, resulting in both ectopic expression of some isoforms and suppression of others. The receptor expression change is accompanied by altered downstream signaling of 5-HT receptors in human breast cancer cells, resulting in resistance to 5-HT-induced apoptosis, and stimulated proliferation.
Conclusions: Our data constitutes the first report of direct involvement of 5-HT in human breast cancer. Increased 5-HT biosynthetic capacity accompanied by multiple changes in 5-HT receptor expression and signaling favor malignant progression of human breast cancer cells (for example, stimulated proliferation, inappropriate cell survival). This occurs through uncoupling of serotonin from the homeostatic regulatory mechanisms of the normal mammary epithelium. The findings open a new avenue for identification of diagnostic and prognostic markers, and valuable new therapeutic targets for managing breast cancer.
Figures


Similar articles
-
Tryptophan hydroxylase 1 and 5-HT7 receptor preferentially expressed in triple-negative breast cancer promote cancer progression through autocrine serotonin signaling.Mol Cancer. 2016 Nov 21;15(1):75. doi: 10.1186/s12943-016-0559-6. Mol Cancer. 2016. PMID: 27871326 Free PMC article.
-
Mammary gland serotonin regulates parathyroid hormone-related protein and other bone-related signals.Am J Physiol Endocrinol Metab. 2012 Apr 15;302(8):E1009-15. doi: 10.1152/ajpendo.00666.2011. Epub 2012 Feb 7. Am J Physiol Endocrinol Metab. 2012. PMID: 22318950 Free PMC article.
-
[Endogenous Serotonin and Milk Production Regulation in the Mammary Gland].Yakugaku Zasshi. 2018;138(6):829-836. doi: 10.1248/yakushi.18-00003. Yakugaku Zasshi. 2018. PMID: 29863055 Review. Japanese.
-
Up-regulation of cathepsin S expression by HSP90 and 5-HT7 receptor-dependent serotonin signaling correlates with triple negativity of human breast cancer.Breast Cancer Res Treat. 2017 Jan;161(1):29-40. doi: 10.1007/s10549-016-4027-1. Epub 2016 Oct 27. Breast Cancer Res Treat. 2017. PMID: 27796714
-
The Role of Serotonin in Breast Cancer Stem Cells.Molecules. 2021 May 26;26(11):3171. doi: 10.3390/molecules26113171. Molecules. 2021. PMID: 34073226 Free PMC article. Review.
Cited by
-
Therapeutic Potential and Limitation of Serotonin Type 7 Receptor Modulation.Int J Mol Sci. 2023 Jan 20;24(3):2070. doi: 10.3390/ijms24032070. Int J Mol Sci. 2023. PMID: 36768393 Free PMC article. Review.
-
Could use of Selective Serotonin Reuptake Inhibitors During Lactation Cause Persistent Effects on Maternal Bone?J Mammary Gland Biol Neoplasia. 2018 Jun;23(1-2):5-25. doi: 10.1007/s10911-018-9390-6. Epub 2018 Mar 30. J Mammary Gland Biol Neoplasia. 2018. PMID: 29603039 Review.
-
Metabolomics based predictive classifier for early detection of pancreatic ductal adenocarcinoma.Oncotarget. 2018 May 1;9(33):23078-23090. doi: 10.18632/oncotarget.25212. eCollection 2018 May 1. Oncotarget. 2018. PMID: 29796173 Free PMC article.
-
A study on construction of a prognosis model for liver cancer based on analgesic targets and screening therapeutic drugs.Genes Genomics. 2024 Jul;46(7):831-850. doi: 10.1007/s13258-024-01515-9. Epub 2024 May 28. Genes Genomics. 2024. PMID: 38807022
-
Tryptophan metabolism in breast cancers: molecular imaging and immunohistochemistry studies.Nucl Med Biol. 2012 Oct;39(7):926-32. doi: 10.1016/j.nucmedbio.2012.01.010. Epub 2012 Mar 22. Nucl Med Biol. 2012. PMID: 22444239 Free PMC article.
References
-
- Paez-Ribes M, Allen E, Hudock J, Takeda T, Okuyama H, Vinals F, Inoue M, Bergers G, Hanahan D, Casanovas O. Antiangiogenic therapy elicits malignant progression of tumors to increased local invasion and distant metastasis. Cancer Cell. 2009;15:220–231. doi: 10.1016/j.ccr.2009.01.027. - DOI - PMC - PubMed
Publication types
MeSH terms
Substances
Grants and funding
LinkOut - more resources
Full Text Sources
Other Literature Sources
Medical

