. 2010 Mar;169(3):331-41.
doi: 10.1016/j.jsb.2009.11.001. Epub 2009 Nov 10.

Radiation damage effects at four specimen temperatures from 4 to 100 K

Affiliations

Radiation damage effects at four specimen temperatures from 4 to 100 K

Benjamin E Bammes et al. J Struct Biol. 2010 Mar.

Abstract

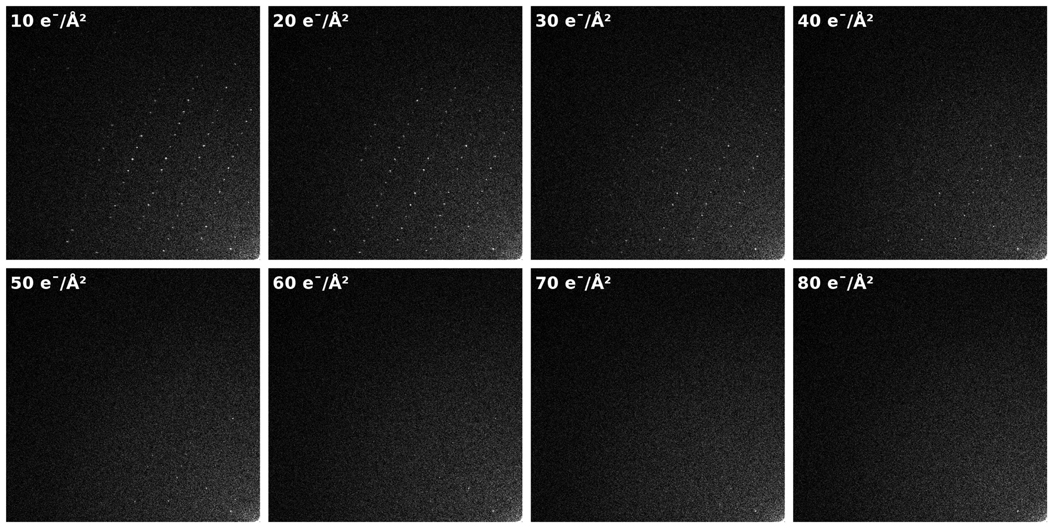
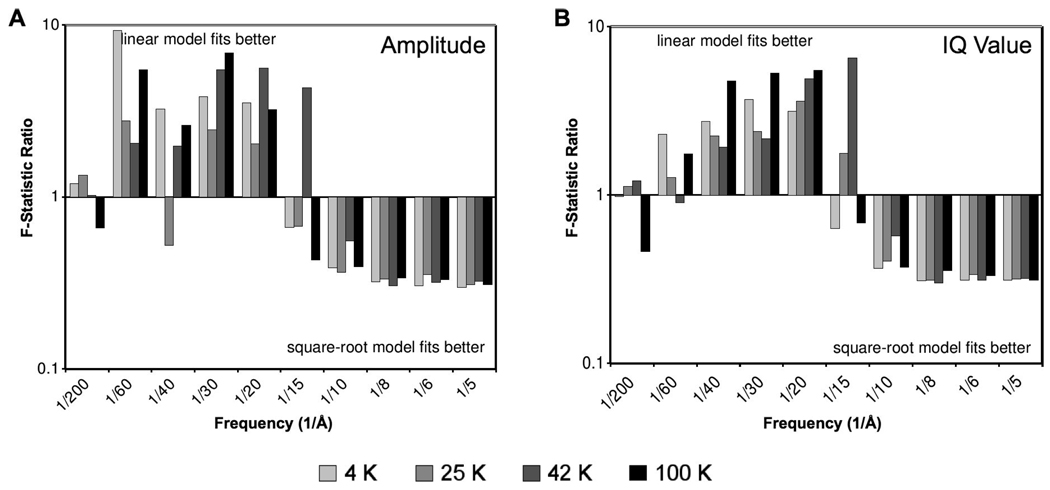
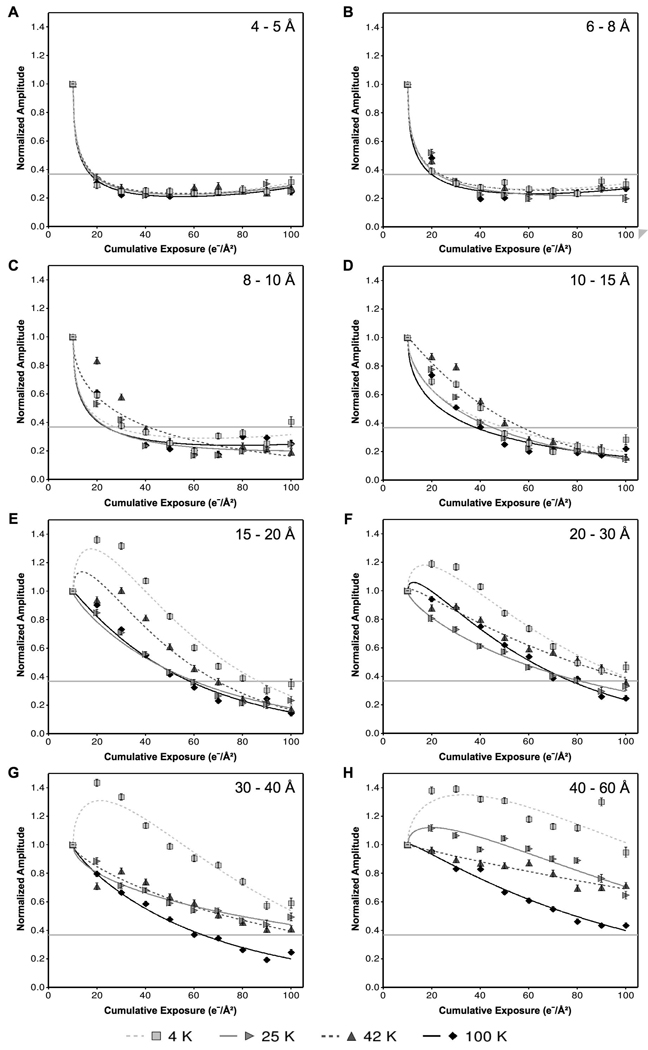
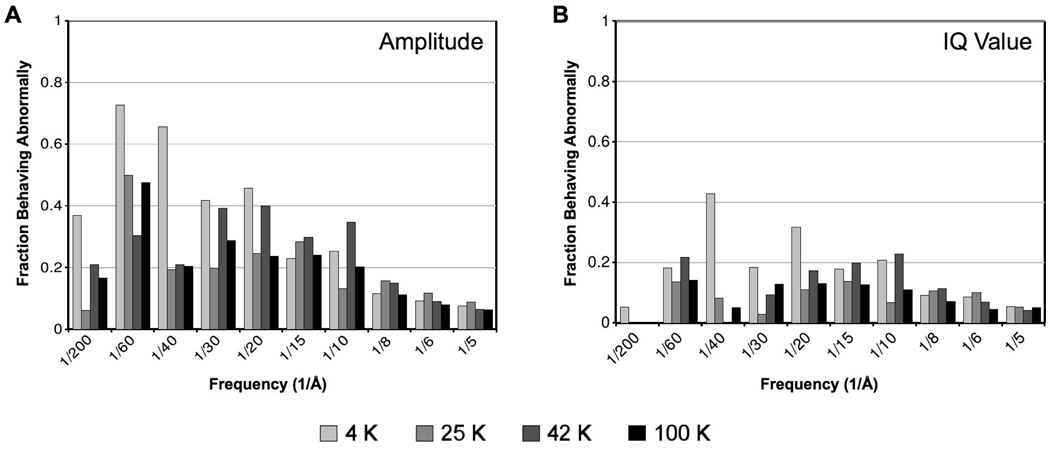
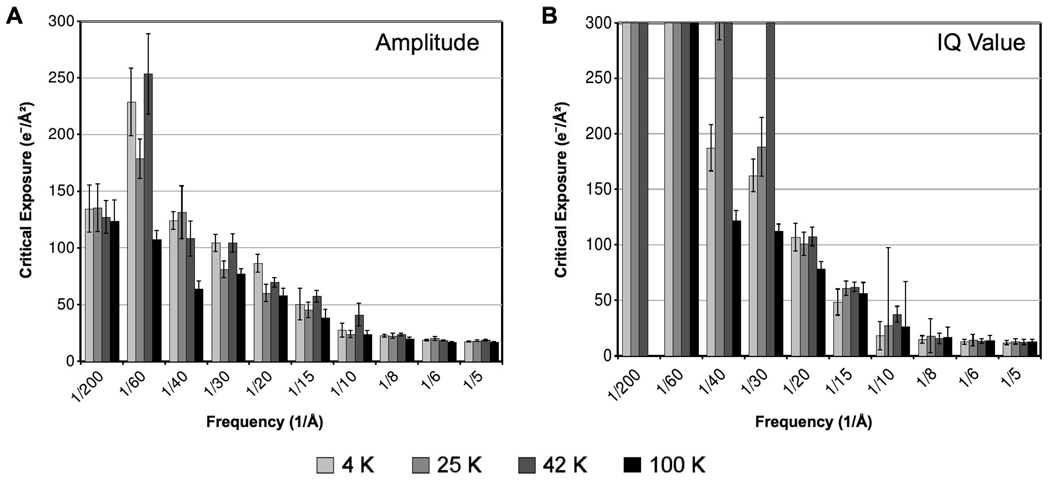
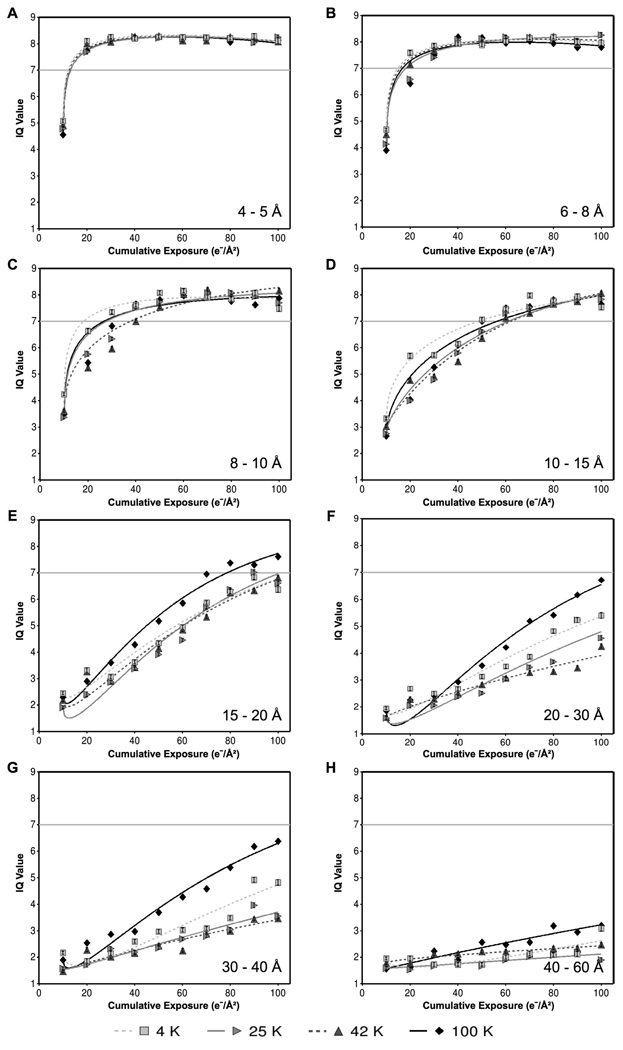
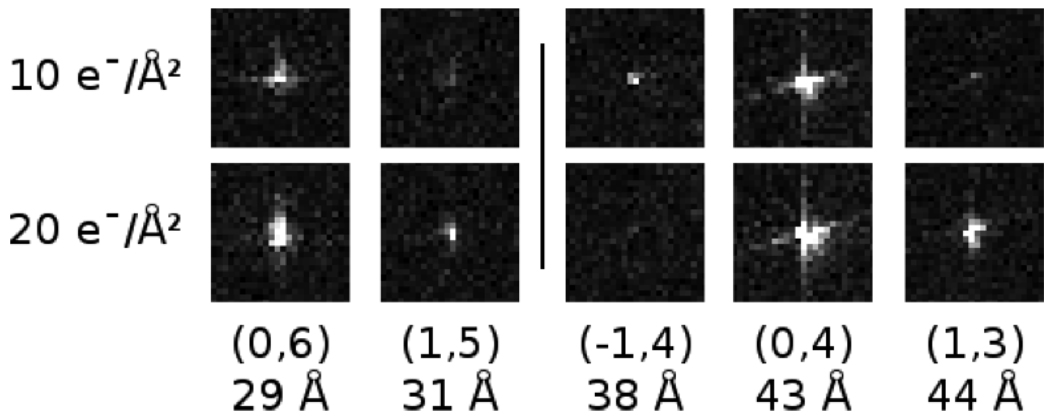
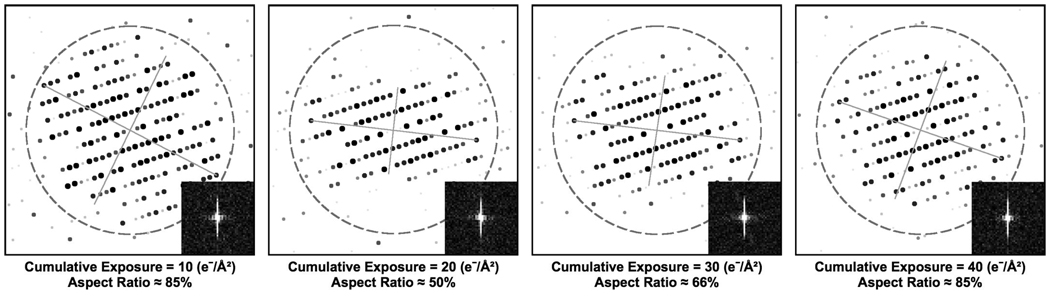
Radiation damage is the primary factor that limits resolution in electron cryo-microscopy (cryo-EM) of frozen-hydrated biological samples. Negative effects of radiation damage are attenuated by cooling specimens to cryogenic temperatures using liquid nitrogen or liquid helium. We have examined the relationship between specimen temperature and radiation damage across a broad spectrum of resolution by analyzing images of frozen-hydrated catalase crystal at four specimen temperatures: 4, 25, 42, and 100K. For each temperature, "exposure series" were collected consisting of consecutive images of the same area of sample, each with 10 e(-)/A(2) exposure per image. Radiation damage effects were evaluated by examining the correlation between cumulative exposure and normalized amplitudes or IQ values of Bragg peaks across a broad range of resolution (4.0-173.5A). Results indicate that for sub-nanometer resolution, liquid nitrogen specimen temperature (100K) provides the most consistent high-quality data while yielding statistically equivalent protection from radiation damage compared to the three lower temperatures. At lower resolution, suitable for tomography, intermediate temperatures (25 or 42K) may provide a modest improvement in cryo-protection without introducing deleterious effects evident at 4 K.


Figures

Figure 1
Figure 1
An example of Fourier transforms of 300 kV images from an exposure series of a catalase crystal at 100 K. Only a quarter-plane of the Fourier-space is shown, with the origin of each Fourier transform in the bottom-right of each frame. Each image was collected with 10 e2 exposure, thus exposing the sample to an incrementally higher cumulative exposure in each image (shown in the top left of each frame).
Figure 2
Figure 2
Plots of F-statistics (ratio of chi-squared values) comparing the quality of fit of two different parametric models of the data: exponential function of exposure (linear model), and exponential function of square-root of exposure (square-root model). Ratios greater than one indicate that the data is best fit by the linear model, and ratios less than one indicate that the data is best fit by the square-root model. The plots based on both normalized Fourier amplitude (A) and IQ value (B) reveals a clear correlation with resolution zone.
Figure 3
Figure 3
Comparison of the effects of four different specimen temperatures on the radiation-induced decay of normalized Fourier amplitudes, grouped into resolution zones: (A) 4–5 Å, (B) 6–8 Å, (C) 8–10 Å, (D) 10–15 Å, (E) 15–20 Å, (F) 20–30 Å, (G) 30–40 Å, (H) 40–60 Å. Each data point represents the mean normalized amplitude of all Bragg peaks within the specified resolution zone at the specified cumulative exposure across all exposure series at the specified temperature. Curves were fit to the data by the method of least squares using an exponential model of exposure and square-root of exposure. Critical exposures were determined by the intersection of the fit models with the threshold value of e−1 (shown as a horizontal gray line).
Figure 4
Figure 4
Comparison of the effect of specimen temperature and spatial frequency on the fraction of Fourier peaks behaving “abnormally” in the second image of each exposure series. We define abnormal behavior as having either increasing normalized amplitude (A) or decreasing IQ value (B) between the first and second image in an exposure series (10 to 20 e2 cumulative exposure). The plots show the fraction of peaks that initially behaved abnormally in each resolution zone across all exposure series examined at each temperature. Overall, normalized Fourier amplitudes in low-resolution zones at 4 K clearly show the most abnormal behavior.
Figure 5
Figure 5
Overall comparison of exposure tolerance at four specimen temperatures according to mean normalized Fourier amplitude decay (A) and mean IQ value decay (B) of Bragg peaks across a broad range of resolution. The critical exposure is the cumulative exposure at which the fitted model of the mean normalized amplitudes crosses e−1, or the fitted model of the mean IQ values crosses 7.
Figure 6
Figure 6
Comparison of the effects of four different specimen temperatures on the radiation-induced decay of IQ values, grouped into resolution zones: (A) 4–5 Å, (B) 6–8 Å, (C) 8–10 Å, (D) 10–15 Å, (E) 15–20 Å, (F) 20–30 Å, (G) 30–40 Å, (H) 40–60 Å. Each data point represents the mean IQ value of all Bragg peaks within the specified resolution zone at the specified cumulative exposure across all exposure series at the specified temperature. Curves were fit to the data by the method of least squares using an exponential model of exposure and square-root of exposure. Critical exposures were determined by the intersection of the fit models with the threshold value of 7 (shown as a horizontal gray line).
Figure 7
Figure 7
Examples from two different exposure series (separated horizontally by a gray line) of the initial behavior of low-resolution Fourier peaks at 4 K. The Miller index and corresponding resolution are shown below each example. The middle example (−1,4) shows the Fourier peak fading with increasing cumulative exposure as expected. However, many of the peaks at 4 K behaved abnormally, increasing in intensity in the second image. Many of these peaks that increased in intensity also appeared to expand in diameter.
Figure 8
Figure 8
Example of IQ plots from the first four images in an exposure series at 4 K. Each plot represents the Fourier transform of an image by showing the IQ values of each Fourier peak (with the largest dots representing an IQ value of 1, and smaller spots representing larger IQ values up to 6). The dashed circle shows the approximate location of the first CTF zero, and the inset in each frame shows the unscattered (central) peak in the respective Fourier transform. The gray cross on each IQ plot corresponds to the axes of ellipse enclosing all Fourier peaks with IQ values of 1 or 2. We quantify isotropy using the ratio of the lengths of these axes (aspect ratio), so that an aspect ratio of 100% corresponds to a perfectly isotropic pattern of Fourier peaks. In three out of the four exposure series examined at 4 K, the Fourier transform of the second image (20 e2 cumulative exposure) suddenly loses isotropy, indicating either beam-induced specimen movement or charging. This effect was not observed at any other specimen temperature.

Similar articles

Cited by

References

    1. Gonen T, Cheng Y, Sliz P, Hiroaki Y, Fujiyoshi Y, Harrison SC, Walz T. Lipid-Protein interactions in double-layered two-dimensional AQP0 crystals. Nature. 2005;438:633–638. - PMC - PubMed
    1. Ludtke SJ, Baker ML, Chen DH, Song JL, Chuang DT, Chiu W. De novo backbone trace of groel from single particle electron cryomicroscopy. Structure. 2008;16:441–448. - PubMed
    1. Jiang W, Baker ML, Jakana J, Weigele PR, King J, Chiu W. Backbone structure of the infectious ε15 virus capsid revealed by electron cryomicroscopy. Nature. 2008;451:1130–1134. - PubMed
    1. Zhang X, Settembre E, Xu C, Dormitzer PR, Bellamy R, Harrison SC, Grigorieff N. Near-Atomic resolution using electron cryomicroscopy and single-particle reconstruction. Proc. Natl. Acad. Sci. USA. 2008;105:1867–1872. - PMC - PubMed
    1. Yu X, Jin L, Zhou ZH. 3.88 Å structure of cytoplasmic polyhedrosis virus by cryo-electron microscopy. Nature. 2008;453:415–419. - PMC - PubMed

Publication types

LinkOut - more resources