

Anterior temporal lobe connectivity correlates with functional outcome after aphasic stroke
- PMID: 19903736
- PMCID: PMC2792371
- DOI: 10.1093/brain/awp270
Anterior temporal lobe connectivity correlates with functional outcome after aphasic stroke
Abstract
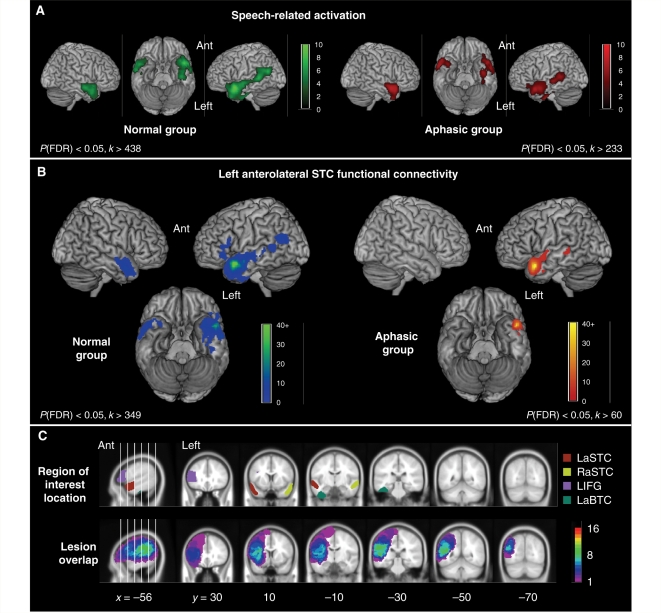
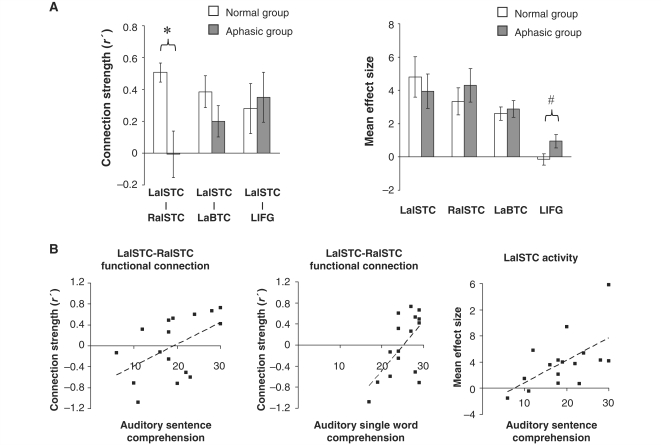
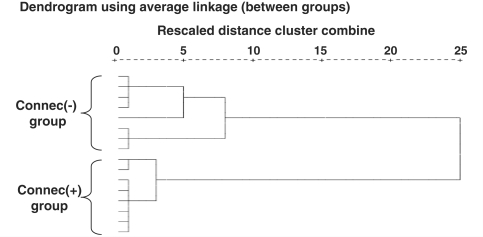
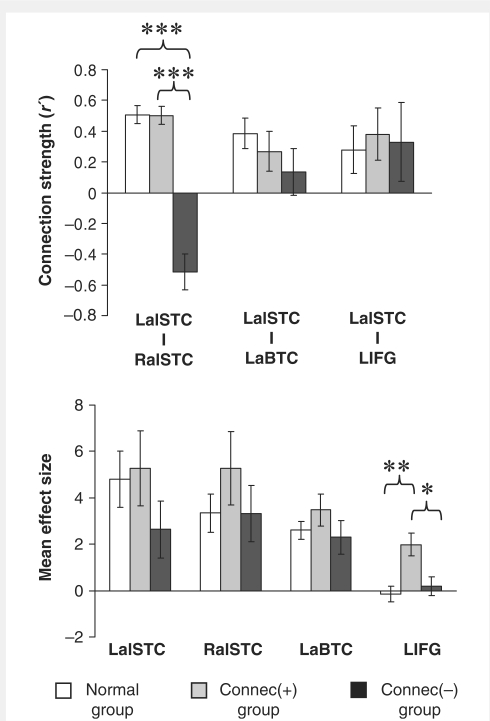
Focal brain lesions are assumed to produce language deficits by two basic mechanisms: local cortical dysfunction at the lesion site, and remote cortical dysfunction due to disruption of the transfer and integration of information between connected brain regions. However, functional imaging studies investigating language outcome after aphasic stroke have tended to focus only on the role of local cortical function. In this positron emission tomography functional imaging study, we explored relationships between language comprehension performance after aphasic stroke and the functional connectivity of a key speech-processing region in left anterolateral superior temporal cortex. We compared the organization of left anterolateral superior temporal cortex functional connections during narrative speech comprehension in normal subjects with left anterolateral superior temporal cortex connectivity in a group of chronic aphasic stroke patients. We then evaluated the language deficits associated with altered left anterolateral superior temporal cortex connectivity in aphasic stroke. During normal narrative speech comprehension, left anterolateral superior temporal cortex displayed positive functional connections with left anterior basal temporal cortex, left inferior frontal gyrus and homotopic cortex in right anterolateral superior temporal cortex. As a group, aphasic patients demonstrated a selective disruption of the normal functional connection between left and right anterolateral superior temporal cortices. We observed that deficits in auditory single word and sentence comprehension correlated both with the degree of disruption of left-right anterolateral superior temporal cortical connectivity and with local activation in the anterolateral superior temporal cortex. Subgroup analysis revealed that aphasic patients with preserved positive intertemporal connectivity displayed better receptive language function; these patients also showed greater than normal left inferior frontal gyrus activity, suggesting a possible 'top-down' compensatory mechanism. These results demonstrate that functional connectivity between anterolateral superior temporal cortex and right anterior superior temporal cortex is a marker of receptive language outcome after aphasic stroke, and illustrate that language system organization after focal brain lesions may be marked by complex signatures of altered local and pathway-level function.
Figures
Similar articles
-
Right anterior superior temporal activation predicts auditory sentence comprehension following aphasic stroke.Brain. 2005 Dec;128(Pt 12):2858-71. doi: 10.1093/brain/awh659. Epub 2005 Oct 18. Brain. 2005. PMID: 16234297
-
Cortical activation studies in aphasia.Curr Neurol Neurosci Rep. 2002 Nov;2(6):511-5. doi: 10.1007/s11910-002-0038-x. Curr Neurol Neurosci Rep. 2002. PMID: 12359105 Review.
-
Changes in Functional Connectivity of Default Mode Network with Auditory and Right Frontoparietal Networks in Poststroke Aphasia.Brain Connect. 2016 Nov;6(9):714-723. doi: 10.1089/brain.2016.0419. Epub 2016 Sep 30. Brain Connect. 2016. PMID: 27506234
-
Cognitive control and its impact on recovery from aphasic stroke.Brain. 2014 Jan;137(Pt 1):242-54. doi: 10.1093/brain/awt289. Epub 2013 Oct 24. Brain. 2014. PMID: 24163248 Free PMC article.
-
Recovery and treatment of aphasia after stroke: functional imaging studies.Curr Opin Neurol. 2007 Dec;20(6):667-73. doi: 10.1097/WCO.0b013e3282f1c6fa. Curr Opin Neurol. 2007. PMID: 17992087 Review.
Cited by
-
Cerebral network disorders after stroke: evidence from imaging-based connectivity analyses of active and resting brain states in humans.J Physiol. 2013 Jan 1;591(1):17-31. doi: 10.1113/jphysiol.2012.243469. Epub 2012 Oct 22. J Physiol. 2013. PMID: 23090951 Free PMC article. Review.
-
Insights gained over 60 years on factors shaping post-stroke aphasia recovery: A commentary on Vignolo (1964).Cortex. 2024 Jan;170:90-100. doi: 10.1016/j.cortex.2023.12.002. Epub 2023 Dec 6. Cortex. 2024. PMID: 38123405 Free PMC article.
-
Functional Connectivity of Language Regions of Stroke Patients with Expressive Aphasia During Real-Time Functional Magnetic Resonance Imaging Based Neurofeedback.Brain Connect. 2019 Oct;9(8):613-626. doi: 10.1089/brain.2019.0674. Epub 2019 Sep 10. Brain Connect. 2019. PMID: 31353935 Free PMC article.
-
Neuroplasticity in Aphasia: A Proposed Framework of Language Recovery.J Speech Lang Hear Res. 2019 Nov 22;62(11):3973-3985. doi: 10.1044/2019_JSLHR-L-RSNP-19-0054. Epub 2019 Nov 22. J Speech Lang Hear Res. 2019. PMID: 31756154 Free PMC article. Review.
-
[Imaging aphasia].Nervenarzt. 2010 Dec;81(12):1429-37. doi: 10.1007/s00115-010-3106-5. Nervenarzt. 2010. PMID: 21079909 German.
References
-
- Adcock JE, Wise RG, Oxbury JM, Oxbury SM, Matthews PM. Quantitative fMRI assessment of the differences in lateralization of language-related brain activation in patients with temporal lobe epilepsy. NeuroImage. 2003;18:423–38. - PubMed
-
- Anwander A, Tittgemeyer M, von Cramon DY, Friederici AD, Knösche TR. Connectivity-based parcellation of Broca's area. Cereb Cortex. 2006;17:816–25. - PubMed
-
- Bates E, Wilson SM, Saygin AP, Dick F, Sereno MI, Knight RT, et al. Voxel-based lesion-symptom mapping. Nat Neurosci. 2003;6:448–50. - PubMed
-
- Bedny M, Hulbert JC, Thompson-Schill SL. Understanding words in context: the role of Broca's area in word comprehension. Brain Res. 2007;1146:101–14. - PubMed
-
- Belin P, Zatorre RJ, Ahad P. Human temporal-lobe response to vocal sounds. Cogn Brain Res. 2002;13:17–26. - PubMed
Publication types
MeSH terms
Grants and funding
LinkOut - more resources
Full Text Sources
Other Literature Sources
Medical
Research Materials
