. 2010 Feb;59(2):448-59.
doi: 10.2337/db09-0129. Epub 2009 Nov 10.

Molecular and metabolic evidence for mitochondrial defects associated with beta-cell dysfunction in a mouse model of type 2 diabetes

Affiliations

Molecular and metabolic evidence for mitochondrial defects associated with beta-cell dysfunction in a mouse model of type 2 diabetes

Hongfang Lu et al. Diabetes. 2010 Feb.

Abstract

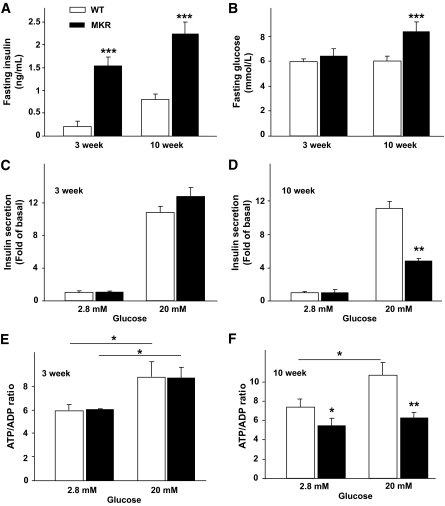
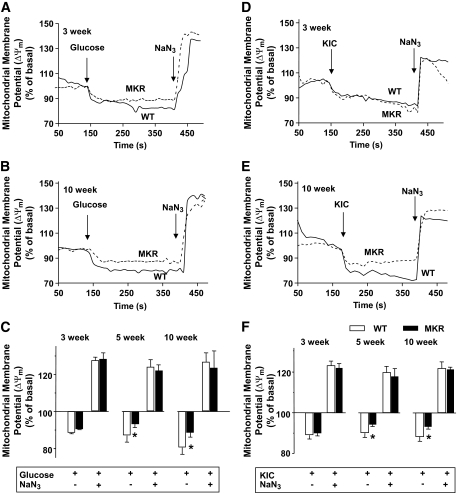
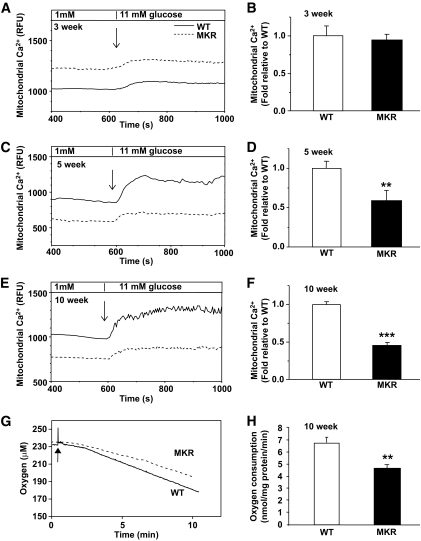
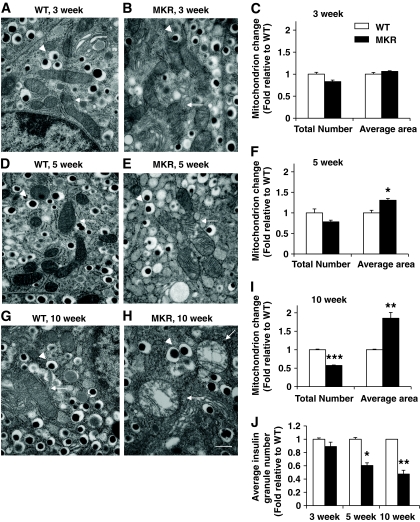
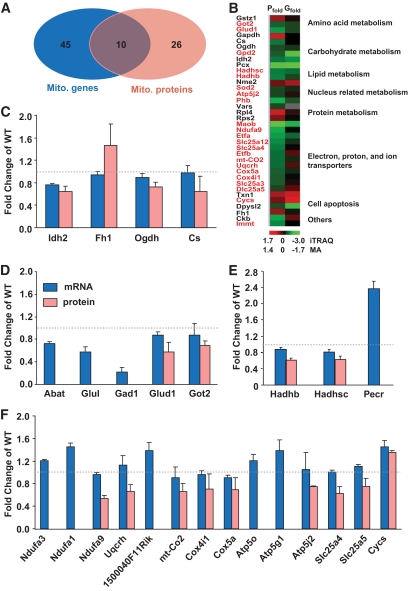
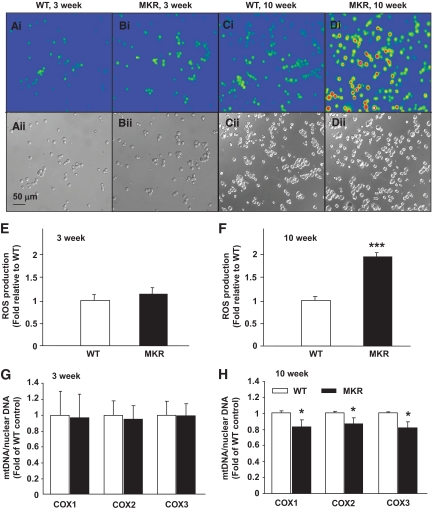
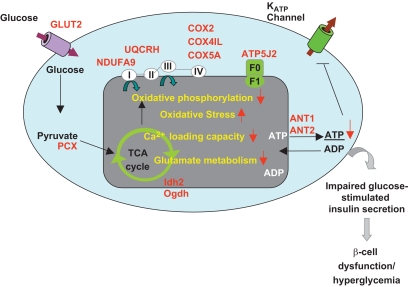
OBJECTIVE The inability of pancreatic beta-cells to appropriately respond to glucose and secrete insulin are primary defects associated with beta-cell failure in type 2 diabetes. Mitochondrial dysfunction has been implicated as a key factor in the development of type 2 diabetes; however, a link between mitochondrial dysfunction and defective insulin secretion is unclear. RESEARCH DESIGN AND METHODS We investigated the changes in islet mitochondrial function and morphology during progression from insulin resistance (3 weeks old), immediately before hyperglycemia (5 weeks old), and after diabetes onset (10 weeks old) in transgenic MKR mice compared with controls. The molecular and protein changes at 10 weeks were determined using microarray and iTRAQ proteomic screens. RESULTS At 3 weeks, MKR mice were hyperinsulinemic but normoglycemic and beta-cells showed negligible mitochondrial or morphological changes. At 5 weeks, MKR islets displayed abrogated hyperpolarization of mitochondrial membrane potential (DeltaPsi(m)), reduced mitochondrial Ca(2+) uptake, slightly enlarged mitochondria, and reduced glucose-stimulated insulin secretion. By 10 weeks, MKR mice were hyperglycemic and hyperinsulinemic and beta-cells contained swollen mitochondria with disordered cristae. beta-Cells displayed impaired stimulus-secretion coupling including reduced hyperpolarization of DeltaPsi(m), impaired Ca(2+)-signaling, and reduced glucose-stimulated ATP/ADP and insulin release. Furthermore, decreased cytochrome c oxidase-dependent oxygen consumption and signs of oxidative stress were observed in diabetic islets. Protein profiling of diabetic islets revealed that 36 mitochondrial proteins were differentially expressed, including inner membrane proteins of the electron transport chain. CONCLUSIONS We provide novel evidence for a critical role of defective mitochondrial oxidative phosphorylation and morphology in the pathology of insulin resistance-induced beta-cell failure.


Figures

FIG. 1.
FIG. 1.
Mouse characterization and islet glucose-stimulated insulin secretion and ATP/ADP ratio. Fasting plasma insulin (A) and blood glucose levels (B). Islets from age-matched MKR and WT mice were exposed to 2.8 or 20 mmol/l glucose. C and D: Islet insulin secretion during 1 h in 3- and 10-week-old islets. GSIS from 5-week-old islets is shown in Fig. S1. E and F: Total islet ATP/ADP ratio. (n = 3 independent experiments with five mice per genotype.) Data are means ± SE. *P < 0.05; **P < 0.01; ***P < 0.001 MKR compared with age-matched WT unless otherwise indicated.
FIG. 2.
FIG. 2.
Decreased mitochondrial membrane potential (ΔΨm) in 5- and 10-week-old MKR β-cells. Mitochondrial membrane potential was measured using Rh123 in dispersed islet cells from 3-week-old (A and D), 5-week-old (Fig. S2), and 10-week-old (B and E) MKR (gray dashed lines) and WT (solid black lines) mice. Mitochondrial membrane potential was estimated by the difference in Rh123 fluorescent signals between hyperpolarized (glucose, 11 mmol/l, A and B; ketoisocaproate [KIC], 10 mmol/l, D and E) and basal and fully depolarized (sodium azide, 5 mmol/l) states. A, B, D, and E: Representative kinetic traces of the fluorescent signal from a single β-cell. C and F: Summary of ΔΨm changes compared with basal levels in WT (□) and MKR (■) islet cells. Results are the percent change from basal fluorescence (1 mmol/l glucose before additions) (n = 3–5 independent experiments, and each experiment used 30–50 cells from three mice per genotype). Data are means ± SE. *P < 0.05 compared with age-matched WT.
FIG. 3.
FIG. 3.
Reduced mitochondrial Ca2+ accumulation and respiration in MKR islets. Islets from 3-week-old (A), 5-week-old (C), and 10-week-old (E) mice were loaded with Rhod-2 and photon emission monitored in a chamber perifused with Krebs-Ringer buffer containing basal (1 mmol/l) and 11 mmol/l glucose. A, C, and E: Representative kinetic traces from a single islet are shown and families of traces from three to four islets per genotype are shown in Fig. S5. B, D, and F: Summary of the difference in Rhod-2 fluorescence (relative fluorescent units [RFU]) between basal (1 mmol/l) and maximal (11 mmol/l) glucose (n = 3–5 independent experiments, and each experiment contains nine islets from three mice per genotype). G and H: O2 consumption in 10-week-old islets supported by respiratory substrates for complex IV (ascorbate and TMPD) was measured. Addition of ascorbate/TMPD (10 mmol/l/0.4 mmol/l) is marked by an arrow. G: Representative trace. H: The slopes of the oxygen consumption curves were measured between 5 and 10 min, the background ascorbate/TMPD effect in the absence of islets was subtracted, and genotypes were compared. WT = solid black line; MKR = gray dotted line (n = 3 with 8–10 mice per genotype in each experiment). Data are means ± SE. **P < 0.01; ***P < 0.001 compared with age-matched WT.
FIG. 4.
FIG. 4.
Mitochondrial ultrastructure is disordered, and dense core insulin granule number is decreased in pancreatic β-cells from 5- and 10-week-old MKR islets. Electron micrographs are shown of ultra-thin sections of islets. β-Cells from 3-week-old WT mice (A) and MKR mice (B) had normal mitochondria (C). Mitochondria in β-cells of 5-week-old MKR mice (E) were slightly swollen (F). The mitochondria of β-cells from 10-week-old MKR diabetic mice (H) were reduced in number and severely swollen with disordered cristae (I) compared with normal mitochondrial morphology in WT control (G). 30,000× magnification. Scale bar equals 500 nm and is shown in the bottom right in H. White arrows indicate mitochondria. Arrowheads indicate insulin granules. Quantitation of total number of mitochondria and average mitochondrial area in 3-week-old (C), 5-week-old (F), and 10-week-old (I) WT and MKR electron microscopic sections. Dense core insulin granules were counted in images at 10,000× magnification (Fig. S6) and number was quantified (J). A total of 50–100 images were analyzed per age with 5–7 mice per genotype. Data are means ± SE. *P < 0.05; **P < 0.01; ***P < 0.001 compared with age-matched WT.
FIG. 5.
FIG. 5.
Mitochondrial genes/protein changes in islets from 10-week-old mice. A: An integrated genomics and proteomics approach revealed 55 mitochondrial genes (Mito. gene) and 36 mitochondrial proteins (Mito. protein) that were significantly differentially expressed in 10-week-old MKR diabetic islets, 10 of which were changed at both the protein and mRNA level. B: A pictorial comparison of changed mitochondrial protein ratios (Pfold) detected by iTRAQ and microarray (MA) (Gfold) analysis together with functional cluster analysis. Hierarchical clustering was performed using the GoMiner program (27) based on the biological process category in the Gene Ontology Consortium. Colors represent average gene/protein expression changes (MKR/WT) relative to the median (26) with red and green representing an increase or decrease in fold expression, respectively. Red labels: mitochondrial inner membrane. C–F: Differentially expressed mitochondrial genes/proteins in MKR diabetic islets related to the TCA cycle (C), glutamate metabolism (D), fatty acid metabolism (E), and electron transport chains (F). Categorical analysis is based on KEGG pathway database using the GeneMAPP program (28). Data are means ± SE. All changes are significant (P < 0.05) compared with age-matched WT.
FIG. 6.
FIG. 6.
Increased pro-oxidant levels and mitochondrial DNA damage in MKR diabetic islet cells. Dispersed islet cells from 3-week-old (A and B) and 10-week-old (C and D) mice were incubated with 10 μmol/l DCF in Krebs-Ringer buffer containing 2.8 mmol/l glucose for 45 min at 37°C. After washing with Krebs-Ringer buffer, cell fluorescence was measured at 480 nm excitation and 510 nm emission using an Olympus fluorescent BX51W1 microscope. A–D: Representative fluorescent (upper panel) and light (lower panel) images of the islet cells. E and F: The average fluorescence intensity was calculated by tracing around each cell and averaging the fluorescence across the entire field of view. (n = 4 with three mice per genotype in each experiment.) mtDNA quantity (G and H) was calculated as the ratio of COX to β-actin DNA levels. (n = 3 with 8–10 mice per genotype in each experiment.) Data are means ± SE. *P < 0.05; ***P < 0.01 compared with age-matched WT. (A high-quality digital representation of this figure is available in the online issue.)
FIG. 7.
FIG. 7.
Summary of the molecular and protein expression changes that lead to the dysfunctional metabolic phenotype in diabetic MKR islets. The proteins highlighted in red were significantly changed in MKR diabetic islets.

Similar articles

Cited by

References

    1. Eriksson J, Franssila-Kallunki A, Ekstrand A, Saloranta C, Widen E, Schalin C, Groop L: Early metabolic defects in persons at increased risk for non-insulin-dependent diabetes mellitus. N Engl J Med 1989;321:337–343 - PubMed
    1. Ferrannini E, Gastaldelli A, Miyazaki Y, Matsuda M, Pettiti M, Natali A, Mari A, DeFronzo RA: Predominant role of reduced beta-cell sensitivity to glucose over insulin resistance in impaired glucose tolerance. Diabetologia 2003;46:1211–1219 - PubMed
    1. Weyer C, Bogardus C, Mott DM, Pratley RE: The natural history of insulin secretory dysfunction and insulin resistance in the pathogenesis of type 2 diabetes mellitus. J Clin Invest 1999;104:787–794 - PMC - PubMed
    1. Matschinsky FM, Magnuson MA, Zelent D, Jetton TL, Doliba N, Han Y, Taub R, Grimsby J: The network of glucokinase-expressing cells in glucose homeostasis and the potential of glucokinase activators for diabetes therapy. Diabetes 2006;55:1–12 - PubMed
    1. MacDonald MJ, Fahien LA: Insulin release in pancreatic islets by a glycolytic and a Krebs cycle intermediate: contrasting patterns of glyceraldehyde phosphate and succinate. Arch Biochem Biophys 1990;279:104–108 - PubMed

Publication types

MeSH terms