

Upregulation of MMP-2 by HMGA1 promotes transformation in undifferentiated, large-cell lung cancer
- PMID: 19903768
- PMCID: PMC3069640
- DOI: 10.1158/1541-7786.MCR-08-0336
Upregulation of MMP-2 by HMGA1 promotes transformation in undifferentiated, large-cell lung cancer
Abstract
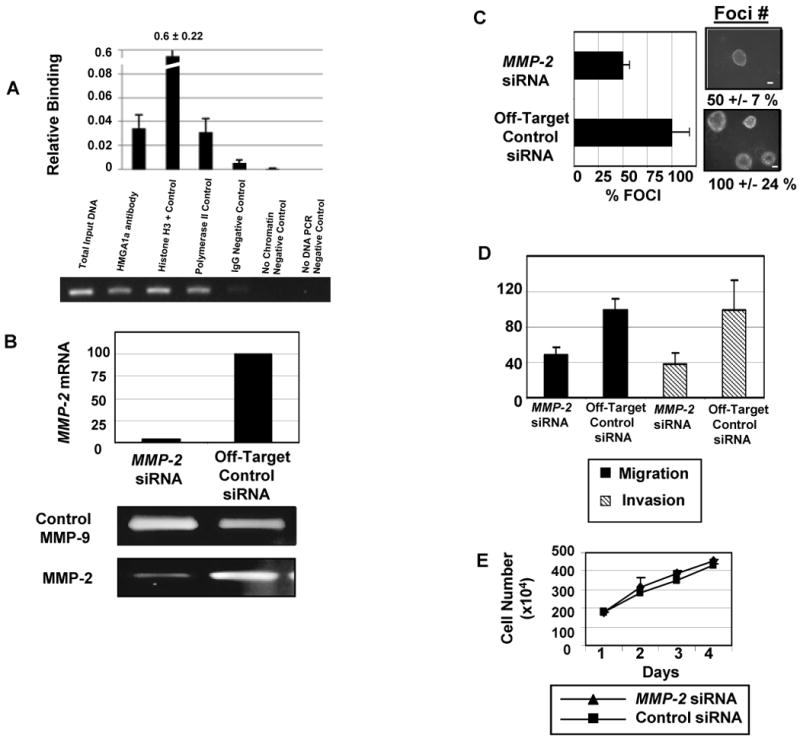
Although lung cancer is the leading cause of cancer death worldwide, the precise molecular mechanisms that give rise to lung cancer are incompletely understood. Here, we show that HMGA1 is an important oncogene that drives transformation in undifferentiated, large-cell carcinoma. First, we show that the HMGA1 gene is overexpressed in lung cancer cell lines and primary human lung tumors. Forced overexpression of HMGA1 induces a transformed phenotype with anchorage-independent cell growth in cultured lung cells derived from normal tissue. Conversely, inhibiting HMGA1 expression blocks anchorage-independent cell growth in the H1299 metastatic, undifferentiated, large-cell human lung carcinoma cells. We also show that the matrix metalloproteinase-2 (MMP-2) gene is a downstream target upregulated by HMGA1 in large-cell carcinoma cells. In chromatin immunoprecipitation experiments, HMGA1 binds directly to the MMP-2 promoter in vivo in large-cell lung cancer cells, but not in squamous cell carcinoma cells. In large-cell carcinoma cell lines, there is a significant, positive correlation between HMGA1 and MMP-2 mRNA. Moreover, interfering with MMP-2 expression blocks anchorage-independent cell growth in H1299 large-cell carcinoma cells, indicating that the HMGA1-MMP-2 pathway is required for this transformation phenotype in these cells. Blocking MMP-2 expression also inhibits migration and invasion in the H1299 large-cell carcinoma cells. Our findings suggest an important role for MMP-2 in transformation mediated by HMGA1 in large-cell, undifferentiated lung carcinoma and support the development of strategies to target this pathway in selected tumors.
Figures


Similar articles
-
The High Mobility Group A1 (HMGA1) gene is highly overexpressed in human uterine serous carcinomas and carcinosarcomas and drives Matrix Metalloproteinase-2 (MMP-2) in a subset of tumors.Gynecol Oncol. 2016 Jun;141(3):580-587. doi: 10.1016/j.ygyno.2016.03.020. Epub 2016 Apr 8. Gynecol Oncol. 2016. PMID: 27001612 Free PMC article.
-
The high-mobility group A1a/signal transducer and activator of transcription-3 axis: an achilles heel for hematopoietic malignancies?Cancer Res. 2008 Dec 15;68(24):10121-7. doi: 10.1158/0008-5472.CAN-08-2121. Cancer Res. 2008. PMID: 19074878 Free PMC article.
-
Long non‑coding RNA LINC01748 exerts carcinogenic effects in non‑small cell lung cancer cell lines by regulating the microRNA‑520a‑5p/HMGA1 axis.Int J Mol Med. 2022 Feb;49(2):22. doi: 10.3892/ijmm.2021.5077. Epub 2021 Dec 31. Int J Mol Med. 2022. PMID: 34970695 Free PMC article.
-
The High Mobility Group A1 (HMGA1) Transcriptome in Cancer and Development.Curr Mol Med. 2016;16(4):353-93. doi: 10.2174/1566524016666160316152147. Curr Mol Med. 2016. PMID: 26980699 Free PMC article. Review.
-
The high mobility group A1 gene: transforming inflammatory signals into cancer?Cancer Res. 2010 Jan 15;70(2):436-9. doi: 10.1158/0008-5472.CAN-09-1212. Epub 2010 Jan 12. Cancer Res. 2010. PMID: 20068164 Free PMC article. Review.
Cited by
-
A protein array screen for Kaposi's sarcoma-associated herpesvirus LANA interactors links LANA to TIP60, PP2A activity, and telomere shortening.J Virol. 2012 May;86(9):5179-91. doi: 10.1128/JVI.00169-12. Epub 2012 Feb 29. J Virol. 2012. PMID: 22379092 Free PMC article.
-
High-mobility group A1 proteins enhance the expression of the oncogenic miR-222 in lung cancer cells.Mol Cell Biochem. 2011 Nov;357(1-2):363-71. doi: 10.1007/s11010-011-0907-1. Epub 2011 Jun 9. Mol Cell Biochem. 2011. PMID: 21656127
-
HMGA1 promotes gastric cancer growth and metastasis by transactivating SUZ12 and CCDC43 expression.Aging (Albany NY). 2021 Jun 24;13(12):16043-16061. doi: 10.18632/aging.203130. Epub 2021 Jun 24. Aging (Albany NY). 2021. PMID: 34167089 Free PMC article.
-
Regulatory Network Analysis to Reveal Important miRNAs and Genes in Non-Small Cell Lung Cancer.Cell J. 2020 Jan;21(4):459-466. doi: 10.22074/cellj.2020.6281. Epub 2019 Jul 29. Cell J. 2020. PMID: 31376328 Free PMC article.
-
High mobility group A1 (HMGA1) protein and gene expression correlate with ER-negativity and poor outcomes in breast cancer.Breast Cancer Res Treat. 2020 Jan;179(1):25-35. doi: 10.1007/s10549-019-05419-1. Epub 2019 Sep 17. Breast Cancer Res Treat. 2020. PMID: 31531802 Free PMC article.
References
-
- American Cancer Society. Cancer Facts & Figures. 2007. www.cancer.org.
-
- Lund T, Holtlund J, Fredriksen M, Laland SG. On the presence of two new high mobility group-like proteins in HeLa S3 cells. FEBS Lett. 1983;152:163–67. - PubMed
-
- Bustin M, Lehn DA, Landsman D. Structural features of the HMG chromosomal proteins and their genes. Biochemica ET Biophysica Acta. 1990;1049:231–43. - PubMed
-
- Johnson KR, Cook SA, Davisson MT. Chromosomal localization of the murine gene and 2 related sequences encoding high-mobility group I and Y proteins. Genomics. 1992;12:503–9. - PubMed
Publication types
MeSH terms
Substances
Grants and funding
LinkOut - more resources
Full Text Sources
Other Literature Sources
Medical
Miscellaneous
