. 2010 Jan 8;285(2):835-44.
doi: 10.1074/jbc.M109.065045. Epub 2009 Nov 10.

N terminus is key to the dominant negative suppression of Ca(V)2 calcium channels: implications for episodic ataxia type 2

Affiliations

N terminus is key to the dominant negative suppression of Ca(V)2 calcium channels: implications for episodic ataxia type 2

Karen M Page et al. J Biol Chem. .

Abstract

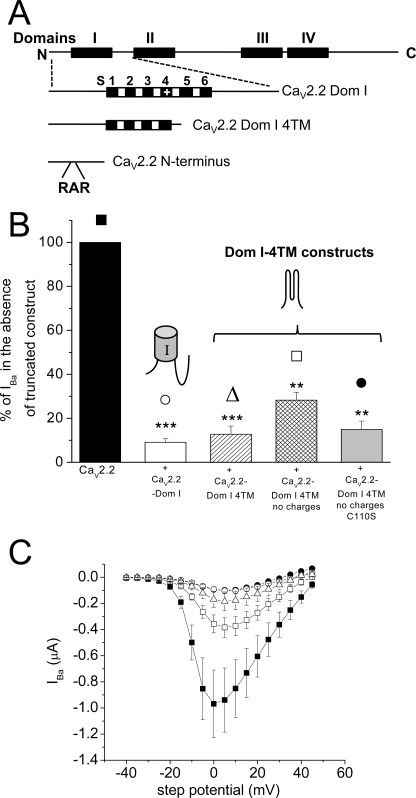
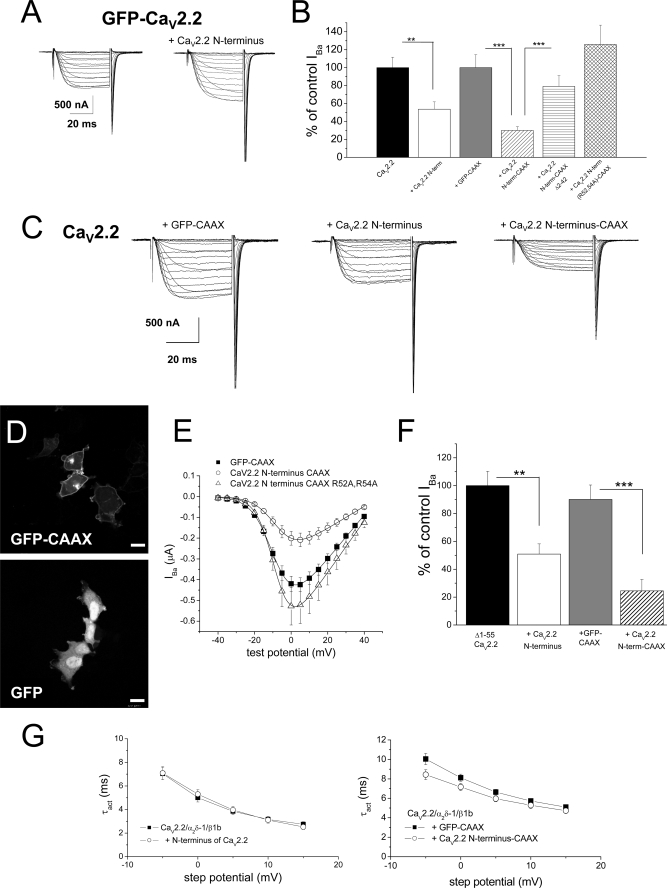
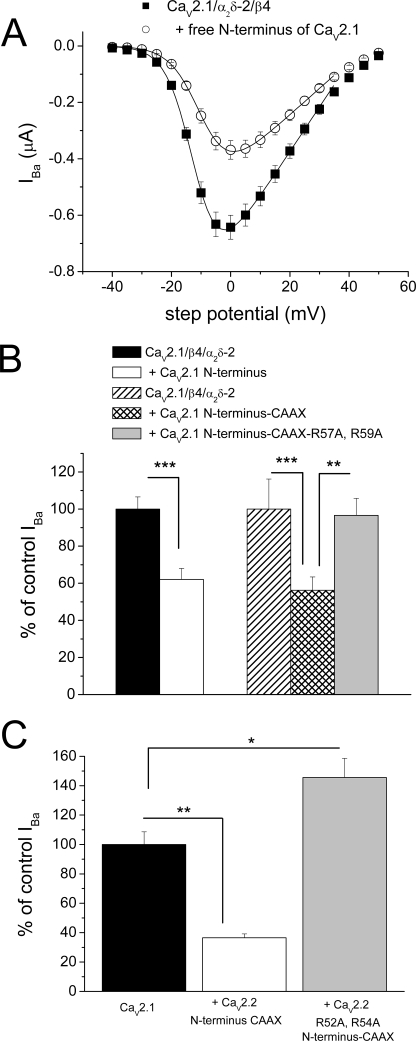
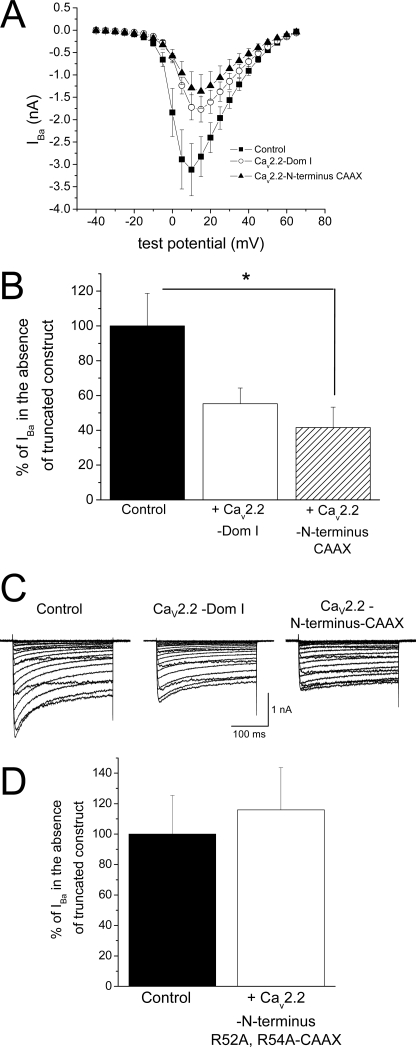
Expression of the calcium channels Ca(V)2.1 and Ca(V)2.2 is markedly suppressed by co-expression with truncated constructs containing Domain I. This is the basis for the phenomenon of dominant negative suppression observed for many of the episodic ataxia type 2 mutations in Ca(V)2.1 that predict truncated channels. The process of dominant negative suppression has been shown previously to stem from interaction between the full-length and truncated channels and to result in downstream consequences of the unfolded protein response and endoplasmic reticulum-associated protein degradation. We have now identified the specific domain that triggers this effect. For both Ca(V)2.1 and Ca(V)2.2, the minimum construct producing suppression was the cytoplasmic N terminus. Suppression was enhanced by tethering the N terminus to the membrane with a CAAX motif. The 11-amino acid motif (including Arg(52) and Arg(54)) within the N terminus, which we have previously shown to be required for G protein modulation, is also essential for dominant negative suppression. Suppression is prevented by addition of an N-terminal tag (XFP) to the full-length and truncated constructs. We further show that suppression of Ca(V)2.2 currents by the N terminus-CAAX construct is accompanied by a reduction in Ca(V)2.2 protein level, and this is also prevented by mutation of Arg(52) and Arg(54) to Ala in the truncated construct. Taken together, our evidence indicates that both the extreme N terminus and the Arg(52), Arg(54) motif are involved in the processes underlying dominant negative suppression.


Figures

FIGURE 1.
FIGURE 1.
Effect of CaV2.2-truncated domains on CaV2.2 IBa when expressed in Xenopus oocytes. A, diagram of the main CaV2.2 constructs used in this study, as described under “Experimental Procedures.” B, peak IBa for CaV2.2/α2δ-2/β1b expressed in Xenopus oocytes without any truncated domains (black bar, 100%) or with CaV2.2-Dom I (white bar, n = 12; ***, p < 0.001), CaV2.2-Dom I-4TMs (hatched bar, n = 17; ***, p < 0.001), CaV2.2-Dom I-4TMs no charges (cross-hatched bar, n = 14; **, p < 0.01), CaV2.2-Dom I-4TMs no charges C110S (light gray bar, n = 23; **, p < 0.01). Data are pooled from several experiments all recorded in 5 mm Ba2+ and normalized to the respective control in each experiment, and the statistical differences were determined compared with their respective control data, using one-way ANOVA and Bonferroni's post hoc test. Error bars indicate S.E. The symbols above the bars refer to the I-V relationship for the representative data in C. C, mean I-V relationship from two pooled experiments for CaV2.2/α2δ-2/β1b expressed in Xenopus oocytes without any truncated domains (■, n = 7) or with CaV2.2-Dom I (○, n = 8), CaV2.2-Dom I 4TMs (▵, n = 4), CaV2.2-Dom I-4TMs no charges (□, n = 11), CaV2.2-Dom I-4TMs no charges C110S (●, n = 7). The symbols are identified above the bars in B. All recordings are in 5 mm Ba2+.
FIGURE 2.
FIGURE 2.
Effect of N-terminally truncated CaV2.2 domains on CaV2.2 IBa when expressed in tsA-201 cells. A, peak IBa was determined from I-V relationships in 1 mm Ba2+ following expression in tsA-201 cells. The currents in the presence of the stated truncated domain are expressed as a percentage of control currents in its absence for CaV2.2/α2δ-2/β1b (filled bars) or Δ1–55 CaV2.2/α2δ-2/β1b (open bars). Data were pooled from several experiments, each examining the effect of one truncated construct, and normalized to the respective control in each experiment. The statistical significances of the differences compared with control were determined by Student's t test; *, p < 0.05. The numbers of determinations are given above each bar. Error bars indicate S.E. B, representative current traces (from −30 to +15 mV at Δ5 mV, from a holding potential of −90 mV), for CaV2.2/α2δ-2/β1b (upper panel) and Δ1–55 CaV2.2/α2δ-2/β1b (lower panel) in the absence or presence of CaV2.2-Dom I, Δ1–55 CaV2.2-Dom I, or Δ2–91 CaV2.2-Dom I. The scale bars refer to all traces.
FIGURE 3.
FIGURE 3.
Effect of Δ2–91 CaV2.2 and YFP-tagged CaV2.2 on CaV2.2 IBa. A, mean I-V relationship for CaV2.2 (■, n = 12) or Δ2–91 CaV2.2 (▵, n = 3) co-expressed with α2δ-2/β1b in Xenopus oocytes, either alone or together (○, n = 13). All recordings are in 10 mm Ba2+. The I-V curves are fit with a modified Boltzmann relationship, as described under “Experimental Procedures.” Inset, bar chart of peak IBa determined from these I-V relationships. The currents in the presence of Δ2–91 CaV2.2 (open bar, n = 13) are expressed as a percentage of control IBa in its absence (black bar), for CaV2.2/α2δ-2/β1b. B, lack of effect of co-expression of CaV2.2 with Δ2–91 CaV2.2 (○, n = 6) on the voltage-dependence of steady-state inactivation of CaV2.2/α2δ-2/β1b IBa (■, n = 8) from the same experiments as in A. Data are fit with a Boltzmann function, as described under “Experimental Procedures.” C, peak IBa was determined from I-V relationships in 1 mm Ba2+ following expression of constructs in tsA-201 cells. The currents in the presence of Δ2–91 CaV2.2 are expressed as a percentage of control IBa in its absence (black bar), for CaV2.2/α2δ-2/β1b (open bar, n = 20), or Δ1–55 CaV2.2/α2δ-2/β1b (gray bar, n = 16). Data were pooled from several experiments and normalized to the respective control in each experiment. The statistical significances of the differences compared with control were determined by Student's t test, p < 0.05. Error bars indicate S.E. D, lack of effect of YFP-CaV2.2-Dom I on YFP-CaV2.2 IBa in Xenopus oocytes. Peak currents at +5 mV are shown for YFP-CaV2.2/α2δ-1/β1b alone (black bar, n = 24) or plus YFP-CaV2.2-Dom I (open bar, n = 20). Data were obtained in three different experiments, all with similar results. No significant differences were observed between the conditions, p > 0.05, Student's t test.
FIGURE 4.
FIGURE 4.
Examination of the effect of the N terminus of CaV2.2 on functional expression of CaV2.2. A, example of current traces for voltage steps from −40 mV to +40 mV from a holding potential of −100 mV for GFP-CaV2.2/α2δ-1/β1b alone (left), and together with CaV2.2 N terminus (right). Recordings were made with 10 mm Ba2+ in Xenopus oocytes. B, peak IBa for CaV2.2/α2δ-1/β1b alone (black bar, n = 22) or together with CaV2.2 N terminus 1–95 (open bar, n = 36), GFP-CAAX (gray bar, n = 16), CaV2.2 N terminus 1–95-CAAX (hatched bar, n = 37), CaV2.2 N terminus Δ2–42-CAAX (horizontal striped bar, n = 25), and R52A/R54A CaV2.2 N terminus-CAAX (cross-hatched bar, n = 19). The statistical significances of the differences indicated were determined by one-way ANOVA and Bonferroni's post hoc test. **, p = 0.0016; ***, p < 0.001. Error bars indicate S.E. C, example of current traces for voltage steps from −40 mV to +40 mV for CaV2.2/α2δ-1/β1b with GFP-CAAX (left), with CaV2.2 N terminus (center), and with CaV2.2 N terminus-CAAX (right). Recordings were made with 10 mm Ba2+. D, representative images showing the distribution of GFP-CAAX (upper panel) and free GFP (lower panel) expression in tsA-201 cells. Scale bars, 20 μm. E, mean I-V relationship for CaV2.2/α2δ-1/β1b expressed in Xenopus oocytes, co-expressed with GFP-CAAX (■, n = 18), CaV2.2 N terminus-CAAX (○, n = 18), or R52A/R54A CaV2.2 N terminus-CAAX (▵, n = 19). All recordings were performed in parallel using 10 mm Ba2+. The I-V curves are fit with a modified Boltzmann relationship, as described under “Experimental Procedures.” The V50, act was −8.6 mV for GFP-CAAX, −7.1 mV for CaV2.2 N terminus-CAAX, and −8.4 mV for R52A/R54A CaV2.2 N terminus-CAAX. F, peak IBa (at 0 mV) for Δ1–55 CaV2.2/α2δ-1/β1b alone (black bar, n = 34) or together with CaV2.2 N terminus (open bar, n = 36), GFP-CAAX (gray bar, n = 10), and CaV2.2 N terminus-CAAX (hatched bar, n = 9). The statistical significances of the differences indicated were determined by Student's two-tailed t test. **, p = 0.002; ***, p < 0.0001. Recordings were made with 10 mm Ba2+. G, voltage dependence of time constant of activation (τact): left, for CaV2.2/α2δ-1/β1b without (■, n = 12) or with (○, n = 7) the free CaV2.2 N terminus; and right, for CaV2.2/α2δ-1/β1b with GFP-CAAX (■, n = 10) or with the free CaV2.2 N terminus-CAAX (○, n = 13).
FIGURE 5.
FIGURE 5.
Examination of the role of the N terminus of CaV2.1 on functional expression of CaV2.1. A, mean I-V relationship for CaV2.1/α2δ-2/β4 in Xenopus oocytes, either alone (■, n = 15) or co-expressed with CaV2.1 N terminus (○, n = 15). All recordings were performed in parallel, using 10 mm Ba2+. The I-V curves were fit with a modified Boltzmann relationship, up to +35 mV. The V50,act was −11.9 mV for control and −9.3 mV in the presence of the CaV2.1 N terminus. B, left panel, peak IBa (at 0 mV) for CaV2.1/α2δ-2/β4 alone (black bar, n = 28) or together with CaV2.1 N terminus (open bar, n = 26), from two independent experiments, including that depicted in A. Right panel, peak IBa for CaV2.1/α2δ-2/β4 alone (hatched bar, n = 9) or together with CaV2.1 N terminus-CAAX (cross-hatched bar, n = 20) or CaV2.1 N terminus R57A/R59A-CAAX (gray bar, n = 20). The statistical significances of the differences indicated were determined by Student's two-tailed t test. **, p = 0.0046; ***, p < 0.001. Error bars indicate S.E. C, peak IBa (at 0 mV) for CaV2.1/α2δ-2/β4 alone (black bar, n = 23) or together with CaV2.2 N terminus-CAAX (open bar, n = 22) or R52A/R54A CaV2.2 N terminus-CAAX (gray bar, n = 22). The statistical significances of the differences indicated were determined by ANOVA and Bonferroni's post hoc test. *, p < 0.01; **, p < 0.001.
FIGURE 6.
FIGURE 6.
Examination of the effect of the N terminus of CaV2.2 on CaV2.2 protein expression. A, expression of CaV2.2 (upper panel) and α2δ-1 (lower panel) protein in untransfected tsA-201 cells (first lane), when CaV2.2/α2δ-1/β1b were expressed, alone (second lane) and together with CaV2.2 N terminus-CAAX (third lane), or R52A/R54A CaV2.2 N terminus-CAAX (fourth lane). The same amount of total protein was loaded for all samples on a gel, for accurate comparison among lanes. B, bar chart from quantification of results, including those in A, showing the effect of CaV2.2 N terminus-CAAX (open bars, n = 6) or R52A/R54A CaV2.2 N terminus-CAAX (gray bars, n = 4) relative to control levels (black bars), for CaV2.2 (left) and α2δ-1 (right) protein levels. The statistical significance of the differences indicated were determined by Student's t test. *, p = 0.0162; **, p = 0.0041. Error bars indicate S.E.
FIGURE 7.
FIGURE 7.
Effect of truncated constructs containing CaV2.2 on expression of endogenous calcium channel currents in DRG neurons. A, I-V relationship recorded in the presence of 10 μm nifedipine for DRG neurons expressing YFP (control, ■, n = 14), CaV2.2 Dom I (○, n = 12), and CaV2.2 N terminus-CAAX) (▴, n = 8). All recordings were performed 4 days after transfection. The mean ± S.E. cell capacitances were 26.4 ± 3.8, 28.4 ± 6.0, and 27.3 ± 5.5 picofarads, respectively, for the three different conditions. B, peak IBa (recorded in the presence of 10 μm nifedipine, at +10 mV) for DRG neurons expressing CaV2.2 Dom I (open bar, n = 12) and CaV2.2 N terminus-CAAX) (hatched bar, n = 8), normalized as a percentage of control (black bar, n = 14). The statistical significances of the differences were determined by one-way ANOVA followed by post-hoc Dunnett's test. *, p < 0.05. Error bars indicate S.E. C, example of current traces for voltage steps between −40 mV and +65 mV for neurons expressing YFP only (control) or with CaV2.2 Dom I or CaV2.2 N terminus-CAAX (left to right). Recordings were made with 10 mm Ba2+ in the presence of 10 μm nifedipine. D, IBa (recorded in the presence of 10 μm nifedipine at +10 mV) for DRG neurons expressing R52A/R54A CaV2.2 N terminus-CAAX (white bar, n = 10), normalized as a percentage of control (black bar, n = 9).

Similar articles

Cited by

References

    1. Catterall W. A. (2000) Annu. Rev. Cell Dev. Biol. 16, 521–555 - PubMed
    1. Ertel E. A., Campbell K. P., Harpold M. M., Hofmann F., Mori Y., Perez-Reyes E., Schwartz A., Snutch T. P., Tanabe T., Birnbaumer L., Tsien R. W., Catterall W. A. (2000) Neuron 25, 533–535 - PubMed
    1. Pietrobon D. (2002) Mol. Neurobiol. 25, 31–50 - PubMed
    1. Ophoff R. A., Terwindt G. M., Vergouwe M. N., van Eijk R., Oefner P. J., Hoffman S. M., Lamerdin J. E., Mohrenweiser H. W., Bulman D. E., Ferrari M., Haan J., Lindhout D., van Ommen G. J., Hofker M. H., Ferrari M. D., Frants R. R. (1996) Cell 87, 543–552 - PubMed
    1. Denier C., Ducros A., Vahedi K., Joutel A., Thierry P., Ritz A., Castelnovo G., Deonna T., Gérard P., Devoize J. L., Gayou A., Perrouty B., Soisson T., Autret A., Warter J. M., Vighetto A., Van Bogaert P., Alamowitch S., Roullet E., Tournier-Lasserve E. (1999) Neurology 52, 1816–1821 - PubMed

Publication types

Substances