. 2009 Nov 24;106(47):19801-6.
doi: 10.1073/pnas.0911447106. Epub 2009 Nov 10.

Production of hyperpolarized [1,4-13C2]malate from [1,4-13C2]fumarate is a marker of cell necrosis and treatment response in tumors

Affiliations

Production of hyperpolarized [1,4-13C2]malate from [1,4-13C2]fumarate is a marker of cell necrosis and treatment response in tumors

Ferdia A Gallagher et al. Proc Natl Acad Sci U S A. .

Abstract

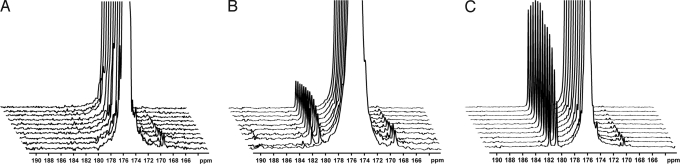
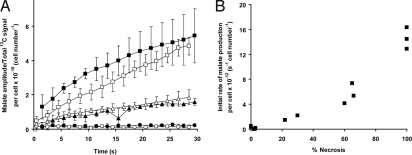
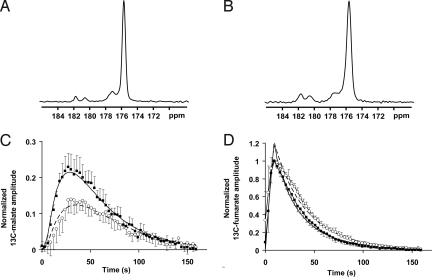
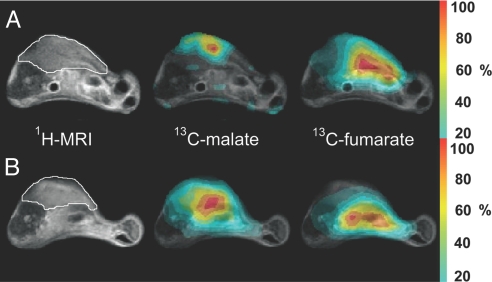
Dynamic nuclear polarization of (13)C-labeled cell substrates has been shown to massively increase their sensitivity to detection in NMR experiments. The sensitivity gain is sufficiently large that if these polarized molecules are injected intravenously, their spatial distribution and subsequent conversion into other cell metabolites can be imaged. We have used this method to image the conversion of fumarate to malate in a murine lymphoma tumor in vivo after i.v. injection of hyperpolarized [1,4-(13)C(2)]fumarate. In isolated lymphoma cells, the rate of labeled malate production was unaffected by coadministration of succinate, which competes with fumarate for transport into the cell. There was, however, a correlation with the percentage of cells that had lost plasma membrane integrity, suggesting that the production of labeled malate from fumarate is a sensitive marker of cellular necrosis. Twenty-four hours after treating implanted lymphoma tumors with etoposide, at which point there were significant levels of tumor cell necrosis, there was a 2.4-fold increase in hyperpolarized [1,4-(13)C(2)]malate production compared with the untreated tumors. Therefore, the formation of hyperpolarized (13)C-labeled malate from [1,4-(13)C(2)]fumarate appears to be a sensitive marker of tumor cell death in vivo and could be used to detect the early response of tumors to treatment. Given that fumarate is an endogenous molecule, this technique has the potential to be used clinically.


Conflict of interest statement

Conflict of interest statement: Grant funding was provided by GE Healthcare.

Figures

Fig. 1.
Fig. 1.
13C spectra acquired over a period of 1 min after injection of hyperpolarized [1,4-13C2]fumarate into suspensions of intact murine lymphoma cells (≈5 × 10⁷ cells) or lysed cells; these are representative spectra from the data shown in Fig. 2. For clarity, only every third spectrum is shown and each series has been scaled to the maximum fumarate signal. (A) Untreated cells. (B) Cells 16 h after etoposide treatment. (C) Lysed cells. The truncated signal from the hyperpolarized [1,4-13C2]fumarate is at 175.4 ppm, the signal from [1-13C]malate at ≈181.8 ppm, and the signal from [4-13C]malate at ≈180.6 ppm.
Fig. 2.
Fig. 2.
Effect of drug treatment and induction of cellular necrosis on 13C label flux between [1,4-13C2]fumarate and [1,4-13C2]malate in EL-4 lymphoma cell suspensions. (A) Ratio of the average [1-13C] and [4-13C]malate peak intensity/total hyperpolarized 13C signal intensity (± SD, n = 3). It has been corrected for total cell number, which includes viable, apoptotic, and necrotic cell populations. Untreated cells (circles), cells 16 h after etoposide treatment (triangles), and lysed cells (squares). The open symbols refer to experiments performed with 10 mM hyperpolarized [1,4-13C2]fumarate only, and the filled symbols show experiments performed with the coadministration of 50 mM nonhyperpolarized and unlabeled succinate; for clarity, the open symbols have been offset by −0.5 s and the filled symbols have been offset by +0.5 s. (B) Rate of malate production (calculated from the initial slope of malate amplitude/total 13C signal over time) plotted against the percentage of cell necrosis in each experiment. The conditions used to vary the levels of necrosis are described in Materials and Methods.
Fig. 3.
Fig. 3.
13C spectra acquired from slices through subcutaneous murine lymphoma tumors. (A and B) Untreated (A) and etopside-treated (B) tumors 30 s after the i.v. injection of hyperpolarized [1,4-13C2]fumarate; these are representative spectra from the experiments shown in C and D. The signal from hyperpolarized fumarate is seen at 175.4 ppm, the signal from [1-13C]malate is seen at ≈181.8 ppm, and the signal from [4-13C]malate is seen at ≈180.6 ppm. An unidentified contaminant is seen at ≈177 ppm. (C) Total hyperpolarized 13C malate signal over time (i.e., the summed intensities of [1-13C] and [4-13C]malate) normalized to the maximum [1,4-13C2]fumarate signal for untreated (○) and etoposide-treated (■) animals (± SD, n = 5). (D) Hyperpolarized [1,4-13C2]fumarate signal in the same animals as in C. The superimposed curves represent the average fits for both the fumarate and the malate resonances using the kinetic modeling described in the text (assuming TM = TF). The solid line represents treated animals, and the dashed line represents untreated animals.
Fig. 4.
Fig. 4.
Representative transverse images from untreated (A) and etoposide-treated (B) mice with s.c.-implanted lymphoma tumors. The 1H image shows the anatomical location of the tumor, outlined in white. Adjacent to this are false-color CSIs superimposed on the 1H image, which demonstrate the spatial distribution of the total hyperpolarized 13C malate and 13C fumarate signals. The color scale indicates the relative signal intensity compared with the maximum intensity in each image. To reduce the effects of noise, voxels with signal intensities ≤20% of the maximum signal intensity were removed from the image. Although the images have been scaled to their respective maxima, the maximum malate signal intensity in each experiment is ≈10–25% of the maximum fumarate signal.

References

    1. Eisenhauer EA, et al. New response evaluation criteria in solid tumors: Revised RECIST guideline (version 1.1) Eur J Cancer. 2009;45:228–247. - PubMed
    1. Brindle K. New approaches for imaging tumor responses to treatment. Nat Rev Cancer. 2008;8:94–107. - PubMed
    1. Sun X, et al. Selective induction of necrotic cell death in cancer cells by βa-lapachone through activation of DNA damage response pathway. Cell Cycle. 2006;5:2029–2035. - PubMed
    1. Verheij M. Clinical biomarkers and imaging for radiotherapy-induced cell death. Cancer Metastasis Rev. 2008;27:471–480. - PubMed
    1. de Bruin EC, Medema JP. Apoptosis and nonapoptotic deaths in cancer development and treatment response. Cancer Treat Rev. 2008;34:737–749. - PubMed

Publication types

MeSH terms

LinkOut - more resources