

Recent national trends in readmission rates after heart failure hospitalization
- PMID: 19903931
- PMCID: PMC2830811
- DOI: 10.1161/CIRCHEARTFAILURE.109.885210
Recent national trends in readmission rates after heart failure hospitalization
Abstract
Background: In July 2009, Medicare began publicly reporting hospitals' risk-standardized 30-day all-cause readmission rates (RSRRs) among fee-for-service beneficiaries discharged after hospitalization for heart failure from all the US acute care nonfederal hospitals. No recent national trends in RSRRs have been reported, and it is not known whether hospital-specific performance is improving or variation in performance is decreasing.
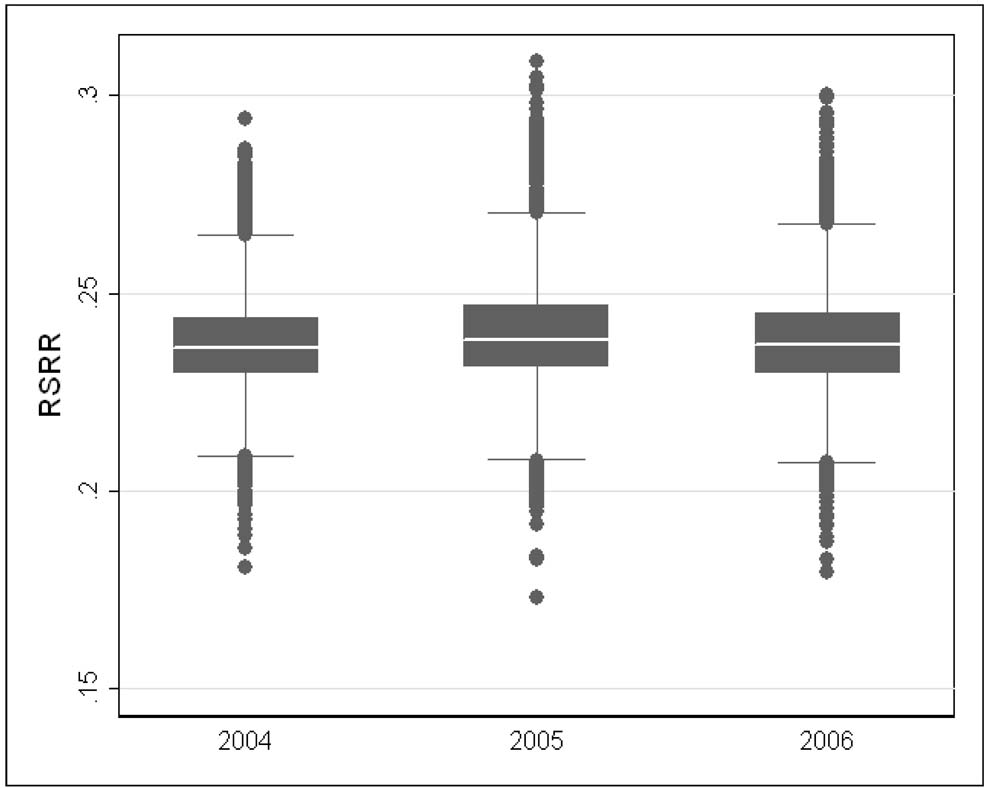
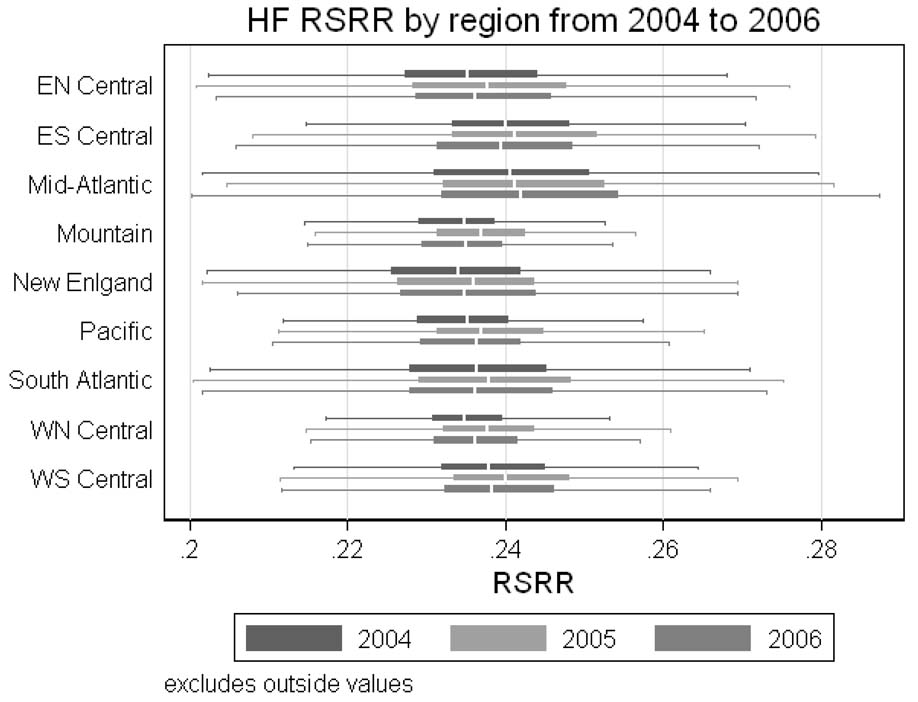
Methods and results: We used 2004-2006 Medicare administrative data to identify all fee-for-service beneficiaries admitted to a US acute care hospital for heart failure and discharged alive. We estimated mean annual RSRRs, a National Quality Forum-endorsed metric for quality, using 2-level hierarchical models that accounted for age, sex, and multiple comorbidities; variation in quality was estimated by the SD of the RSRRs. There were 570 996 distinct hospitalizations for heart failure in which the patient was discharged alive in 4728 hospitals in 2004, 544 550 in 4694 hospitals in 2005, and 501 234 in 4674 hospitals in 2006. Unadjusted 30-day all-cause readmission rates were virtually identical over this period: 23.0% in 2004, 23.3% in 2005, and 22.9% in 2006. The mean and SD of RSRRs were also similar: mean (SD) of 23.7% (1.3) in 2004, 23.9% (1.4) in 2005, and 23.8% (1.4) in 2006, suggesting similar hospital variation throughout the study period.
Conclusions: National mean and RSRR distributions among Medicare beneficiaries discharged after hospitalization for heart failure have not changed in recent years, indicating that there was neither improvement in hospital readmission rates nor in hospital variations in rates over this time period.
Conflict of interest statement
Figures
Comment in
-
Letter by DiDomenico et al regarding article, "Recent national trends in readmission rates after heart failure hospitalization".Circ Heart Fail. 2010 May;3(3):e13; author reply e17. doi: 10.1161/CIRCHEARTFAILURE.110.947614. Circ Heart Fail. 2010. PMID: 20484187 No abstract available.
References
-
- Center for Medicare & Medicaid Services Hospital Pay-for-Performance Workgroup. U.S. Department of Health and Human Services Medicare Hospital Value-Based Purchasing Plan Development, Issues Paper, 1st Public Listening Session. Center for Medicare & Medicaid Services. 2007. Jan 17 [Accessed October 27, 2008]. Available at: http://www.cms.hhs.gov/AcuteInpatientPPS/Downloads/Hospital_VBP_Plan_Iss....
-
- Institute of Medicine. Rewarding provider performance: aligning incentives in Medicare. Washington, DC: National Academy Press; 2007.
-
- Medicare Payment Advisory Commission. Promoting greater efficiency in Medicare, report to the Congress. Medicare Payment Advisory Commission. [Accessed July 17, 2007]. Available at: http://www.medpac.gov/documents/Jun07_EntireReport.pdf.
-
- National Quality Forum. National Voluntary Consensus Standards for Hospital Care 2007: Performance Measures -- A consensus report. Washington, DC: National Quality Forum; 2008.
-
- Krumholz HM, Brindis RG, Brush JE, Cohen DJ, Epstein AJ, Furie K, Howard G, Peterson ED, Rathore SS, Smith SC, Jr, Spertus JA, Wang Y, Normand SL. Standards for statistical models used for public reporting of health outcomes: an American Heart Association Scientific Statement from the Quality of Care and Outcomes Research Interdisciplinary Writing Group: cosponsored by the Council on Epidemiology and Prevention and the Stroke Council. Endorsed by the American College of Cardiology Foundation. Circulation. 2006;113(3):456–462. - PubMed
Publication types
MeSH terms
Grants and funding
LinkOut - more resources
Full Text Sources
Other Literature Sources
Medical
