. 2009 Nov 17;101(10):1758-68.
doi: 10.1038/sj.bjc.6605355.

Humanised IgG1 antibody variants targeting membrane-bound carcinoembryonic antigen by antibody-dependent cellular cytotoxicity and phagocytosis

Affiliations

Humanised IgG1 antibody variants targeting membrane-bound carcinoembryonic antigen by antibody-dependent cellular cytotoxicity and phagocytosis

S Q Ashraf et al. Br J Cancer. .

Abstract

Background: The effect of glycoengineering a membrane specific anti-carcinoembryonic antigen (CEA) (this paper uses the original term CEA for the formally designated CEACAM5) antibody (PR1A3) on its ability to enhance killing of colorectal cancer (CRC) cell lines by human immune effector cells was assessed. In vivo efficacy of the antibody was also tested.

Methods: The antibody was modified using EBNA cells cotransfected with beta-1,4-N-acetylglucosaminyltransferase III and the humanised hPR1A3 antibody genes.

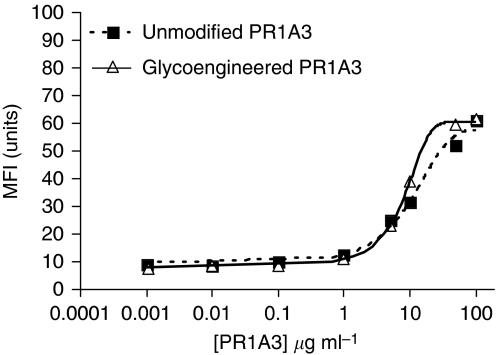
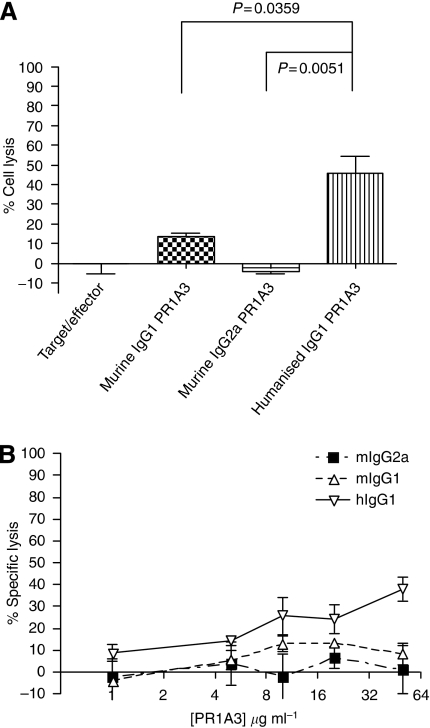
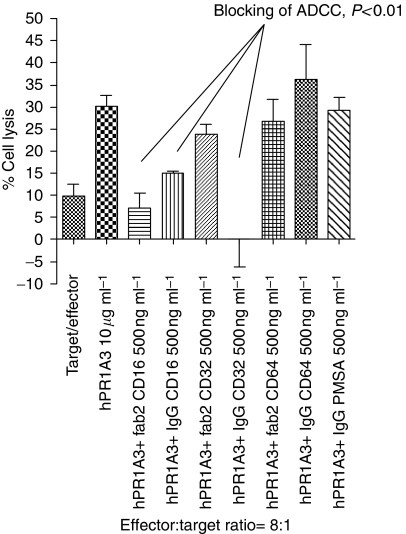
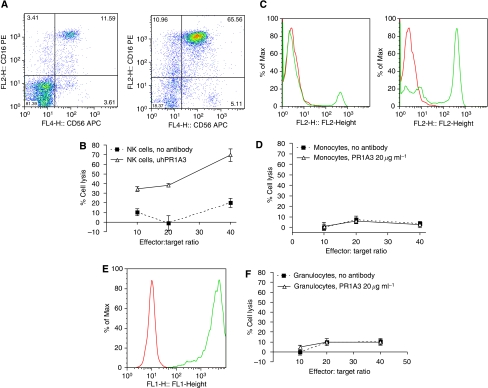
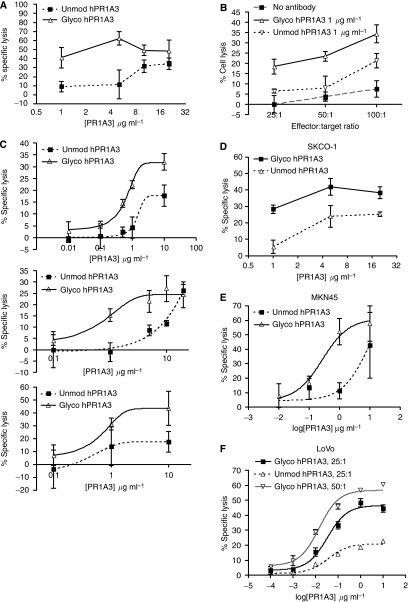
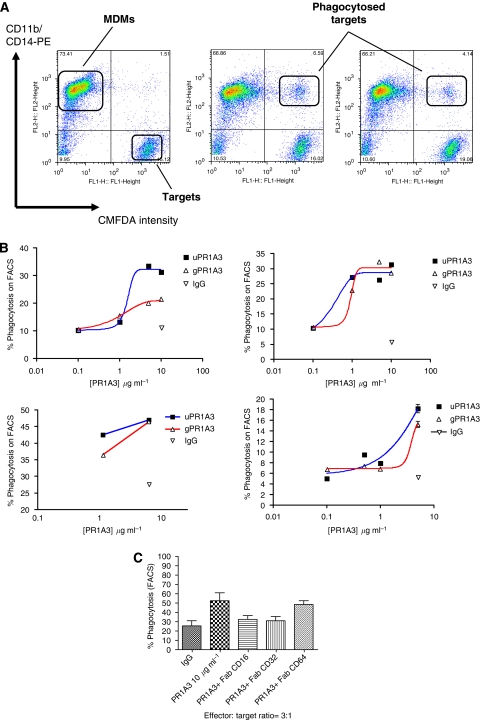
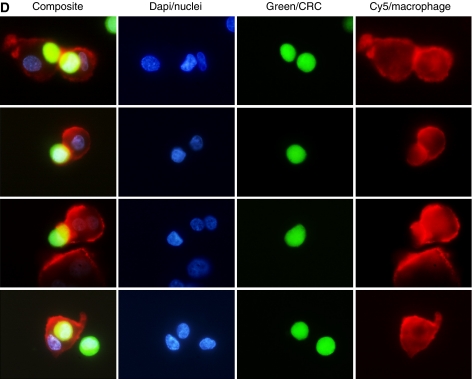
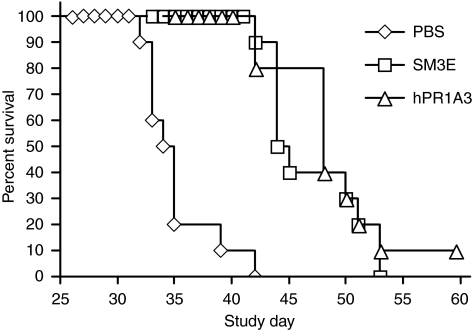
Results: The resulting alteration of the Fc segment glycosylation pattern enhances the antibody's binding affinity to the FcgammaRIIIa receptor on human immune effector cells but does not alter the antibody's binding capacity. Antibody-dependent cellular cytotoxicity (ADCC) is inhibited in the presence of anti-FcgammaRIII blocking antibodies. This glycovariant of hPR1A3 enhances ADCC 10-fold relative to the parent unmodified antibody using either unfractionated peripheral blood mononuclear or natural killer (NK) cells and CEA-positive CRC cells as targets. NK cells are far more potent in eliciting ADCC than either freshly isolated monocytes or granulocytes. Flow cytometry and automated fluorescent microscopy have been used to show that both versions of hPR1A3 can induce antibody-dependent cellular phagocytosis (ADCP) by monocyte-derived macrophages. However, the glycovariant antibody did not mediate enhanced ADCP. This may be explained by the relatively low expression of FcgammaRIIIa on cultured macrophages. In vivo studies show the efficacy of glycoengineered humanised IgG1 PR1A3 in significantly improving survival in a CRC metastatic murine model.

Conclusion: The greatly enhanced in vitro ADCC activity of the glycoengineered version of hPR1A3 is likely to be clinically beneficial.


Figures

Figure 1
Figure 1
Comparison of the binding of unmodified humanised IgG1 PR1A3 (uhPR1A3) and glycoengineered IgG1 PR1A3 (ghPR1A3) to the high CEA expressing cell line SKCO-1. Mean fluorescent intensities, based on flow cytometric analysis, of uhPR1A3 and ghPR1A3 at different antibody concentrations. Sigmoidal dose–response curves are fitted using Prism Graphpad software (goodness of fit, R2>0.98).
Figure 2
Figure 2
(A) Comparison of the ADCC activity of PR1A3 antibodies with differing Fc portions (murine IgG1, murine IgG2a and humanised IgG1). PBMC were used as effectors and SKCO-1 used as the target (100 : 1 effector : target ratio). Antibodies were used at a final concentration of 10 μg ml−1. The control was targets and effectors with no antibody. The P-values are for the significance of the differences between controls and the hIgG1PR1A3 results, based on t-tests. (B) Comparison of the ADCC activity of PR1A3 antibodies with differing Fc portions (murine IgG1, murine IgG2a and humanised IgG1) over a range of antibody concentrations from 1 to 50 μg ml−1. PBMC were used as effectors and SKCO-1 as target (50 : 1, effector : target ratio).
Figure 3
Figure 3
Effect of FcγR blocking on unmodified humanised PR1A3-induced ADCC, using anti-CD16, 32 and 64 Fab2 or IgG. SKCO-1 was used as the target and NK cells as the effectors (effector : target ratio=8 : 1). The P-values are for the significance of the differences between the result using hIgG1PR1A3 and no blocking antibody, based on t-tests.
Figure 4
Figure 4
Comparative ADCC activity of different cell types from a single healthy donor. (A) FACS analysis dot plot showing the enrichment of NK cells from PBMC (x-axis, CD56; y-axis, CD16) pre (left-hand dot pot) and post (right-hand dot plot) sorting. (B) NK ADCC activity. Graph of NK ADCC activity against SKCO-1 in the absence and presence of 20 μg ml−1 of hPR1A3 at different effector : target ratios (x-axis) vs % cell lysis (y-axis). (C) FACS analysis plot showing the enrichment of monocytes from PBMC (x-axis, CD14 intensity; y-axis, number of events)- pre (left-hand histogram plot) and post (right-hand histogram plot) sorting. Grey line presents staining using CD14 antibody-PE; dark line represents staining with isotype antibody control-PE. (D) Monocyte ADCC activity. Graph of monocyte ADCC activity against SKCO-1, in the absence and presence of 20 μg ml−1 of hPR1A3, at different effector : target ratios (x-axis) vs % cell lysis (y-axis). (E) FACS analysis plot showing the enrichment of granulocytes from fresh blood after sorting (x-axis, CD15 intensity; y-axis, frequency of events). Grey line presents staining using CD15 antibody-FITC; dark line represents staining with isotype antibody control-FITC. (F) Granulocyte ADCC activity. Graph of granulocyte ADCC activity against SKCO-1 in the absence and presence of 20 μg ml−1 of hPR1A3, at different effector : target ratios (x-axis) vs % cell lysis (y-axis).
Figure 5
Figure 5
(A) Comparison of ADCC activity of glycoform engineered humanised PR1A3 (ghPR1A3) with unmodified humanised PR1A3 (uhPR1A3) using PBMC. SKCO-1 were used as targets. Effector : target ratio used was 50 : 1 (x-axis, concentration of PR1A3 used; y-axis, % specific lysis). (B) Comparison of ADCC activity of ghPR1A3 with uhPR1A3 at different effector : target ratios and a fixed antibody concentration of 1 μg ml−1 for both variants. The target cells were SKCO-1 and effectors PBMCs from fresh blood (x-axis, effector : target ratio used; y-axis, % specific lysis). (C) Comparison of ADCC activity of ghPR1A3 with uhPR1A3, using PBMC from three separate donors. SKCO-1 (a high CEA expressing cell line) were the targets. Effector : target ratio was 50 : 1 (x-axis, concentration of PR1A3 used; y-axis, % specific lysis). (D) Comparison of ADCC activity of ghPR1A3 with uhPR1A3 using human NK cells and SKCO-1 as targets (x-axis, concentration of PR1A3 used; y-axis, % specific lysis). Effector : target ratio used was 10 : 1. (E) Comparison of ADCC activity of ghPR1A3 with uhPR1A3, using PBMC as effectors, on MKN45 (an intermediate CEA expressing cell line) as the targets. Effector : target ratio was 50 : 1 (x-axis, log concentration of PR1A3 used; y-axis, % specific lysis). (F) Comparison of ADCC activity of ghPR1A3 with uhPR1A3, using PBMC as effectors on LoVo (an intermediate CEA expressing cell line) as the targets. Effector : target ratio was either 25 : 1 or 50 : 1 (x-axis, log concentration of PR1A3 used; y-axis, % specific lysis).
Figure 6
Figure 6
(A) Flow cytometric analysis of ADCP. SKCO-1 target cells were stained green with CMFDA and are present in the right lower quadrant of the dot plots. Macrophages were stained with anti-CD11b and CD14 conjugated with PE. They appear in the left upper quadrant of the dot plots. The left hand dot plot is from a representative 1-h culture of macrophages and target cells (SKCO-1) in the presence of IgG isotype control. The middle and right plots are from representative 1-h cultures of macrophages and target cells in the presence of uhPR1A3 and ghPR1A3, respectively (5 μg ml−1). The effector : target ratio used was 5 : 1. (B) Effect of increasing concentrations of uhPR1A3 and ghPR1A3 on phagocytosis. Tumour targets were pre-incubated with an isotype control antibody (IgG, 10 μg ml−1) or the variants of hPR1A3 at concentrations of 0.1–10 μg ml−1. ADCP was determined by flow cytometric analysis as the percentage of targets in the upper right hand quadrant (see Figure 6C). The four graphs represent responses from four separate donors. (C) Effect of FcγR blocking on ADCP. Flow cytometry was used to calculate the percentage of tumour cell engulfment by cultured macrophages in the presence of 10 μg ml−1 of uhPR1A3. Fab2 fragments were used to block either FcγR I (CD64), FcγR II (CD32) or FcγR III (CD16) (each antibody concentration was1 μg ml−1). The effector : target ratio used was 3 : 1, and the targets were SKCO-1. (D) Fluorescent images of macrophages phagocytosing SKCO-1 using the Ikoniscope. The macrophages (red) have been stained with anti-CD14 and anti-CD11b primary antibodies followed by goat anti-mouse-HRP and Tyramide 647. The target cell line (SKCO-1) was stained green with CMFDA (Celltracker probe). The left hand panels show microscope composite images viewed with FITC (green), Cy5 (for tyramide 647) and DAPI (blue) channels. The second, third and fourth panel column show the same cells viewed separately with the DAPI, green and Cy5 channels. Each represents a different phagocytic event.
Figure 6
Figure 6
(A) Flow cytometric analysis of ADCP. SKCO-1 target cells were stained green with CMFDA and are present in the right lower quadrant of the dot plots. Macrophages were stained with anti-CD11b and CD14 conjugated with PE. They appear in the left upper quadrant of the dot plots. The left hand dot plot is from a representative 1-h culture of macrophages and target cells (SKCO-1) in the presence of IgG isotype control. The middle and right plots are from representative 1-h cultures of macrophages and target cells in the presence of uhPR1A3 and ghPR1A3, respectively (5 μg ml−1). The effector : target ratio used was 5 : 1. (B) Effect of increasing concentrations of uhPR1A3 and ghPR1A3 on phagocytosis. Tumour targets were pre-incubated with an isotype control antibody (IgG, 10 μg ml−1) or the variants of hPR1A3 at concentrations of 0.1–10 μg ml−1. ADCP was determined by flow cytometric analysis as the percentage of targets in the upper right hand quadrant (see Figure 6C). The four graphs represent responses from four separate donors. (C) Effect of FcγR blocking on ADCP. Flow cytometry was used to calculate the percentage of tumour cell engulfment by cultured macrophages in the presence of 10 μg ml−1 of uhPR1A3. Fab2 fragments were used to block either FcγR I (CD64), FcγR II (CD32) or FcγR III (CD16) (each antibody concentration was1 μg ml−1). The effector : target ratio used was 3 : 1, and the targets were SKCO-1. (D) Fluorescent images of macrophages phagocytosing SKCO-1 using the Ikoniscope. The macrophages (red) have been stained with anti-CD14 and anti-CD11b primary antibodies followed by goat anti-mouse-HRP and Tyramide 647. The target cell line (SKCO-1) was stained green with CMFDA (Celltracker probe). The left hand panels show microscope composite images viewed with FITC (green), Cy5 (for tyramide 647) and DAPI (blue) channels. The second, third and fourth panel column show the same cells viewed separately with the DAPI, green and Cy5 channels. Each represents a different phagocytic event.
Figure 7
Figure 7
In vivo testing of glycoengineered PR1A3. Survival was measured in SCID/beige mice treated with either glycomodified humanised IgG1 PR1A3 (▵), glycomodified IgG1 SM3E (□) or vehicle control (⋄) (n=10 in each treatment group). Y-axis represents % survival and x-axis represents number of days after injection of tumour. Both SM3E and PR1A3 increased survival significantly when compared with the vehicle control (P<0.05). There was no significant difference in survival between SM3E and PR1A3 treatments.

Similar articles

Cited by

References

    1. Adams GP, Weiner LM (2005) Monoclonal antibody therapy of cancer. Nat Biotechnol 23: 1147–1157 - PubMed
    1. Akewanlop C, Watanabe M, Singh B, Walker M, Kufe DW, Hayes DF (2001) Phagocytosis of breast cancer cells mediated by anti-MUC-1 monoclonal antibody, DF3, and its bispecific antibody. Cancer Res 61: 4061–4065 - PubMed
    1. Benitez-Ribas D, Adema GJ, Winkels G, Klasen IS, Punt CJ, Figdor CG, de Vries IJ (2006) Plasmacytoid dendritic cells of melanoma patients present exogenous proteins to CD4+ T cells after Fc gamma RII-mediated uptake. J Exp Med 203: 1629–1635 - PMC - PubMed
    1. Blomberg K, Hautala R, Lovgren J, Mukkala VM, Lindqvist C, Akerman K (1996) Time-resolved fluorometric assay for natural killer activity using target cells labelled with a fluorescence enhancing ligand. J Immunol Methods 193: 199–206 - PubMed
    1. Blumenthal RD, Hansen HJ, Goldenberg DM (2008) In vitro and in vivo anticancer efficacy of unconjugated humanized anti-CEA monoclonal antibodies. Br J Cancer 99: 837–838; author reply 839–840 - PMC - PubMed

Publication types

MeSH terms