Around-the-objective total internal reflection fluorescence microscopy
- PMID: 19904308
- PMCID: PMC2802224
- DOI: 10.1364/AO.48.006120
Around-the-objective total internal reflection fluorescence microscopy
Abstract
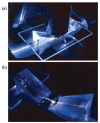
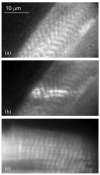
Total internal reflection fluorescence (TIRF) microscopy uses the evanescent field on the aqueous side of a glass/aqueous interface to selectively illuminate fluorophores within approximately 100 nm of the interface. Applications of the method include epi-illumination TIRF, where the exciting light is refracted by the microscope objective to impinge on the interface at incidence angles beyond critical angle, and prism-based TIRF, where exciting light propagates to the interface externally to the microscope optics. The former has higher background autofluorescence from the glass elements of the objective where the exciting beam is focused, and the latter does not collect near-field emission from the fluorescent sample. Around-the-objective TIRF, developed here, creates the evanescent field by conditioning the exciting laser beam to propagate through the submillimeter gap created by the oil immersion high numerical aperture objective and the glass coverslip. The approach eliminates background light due to the admission of the laser excitation to the microscopic optics while collecting near-field emission from the dipoles excited by the approximately 50 nm deep evanescent field.
Figures


Similar articles
-
Measuring incidence angle for through-the-objective total internal reflection fluorescence microscopy.J Biomed Opt. 2012 Dec;17(12):126007. doi: 10.1117/1.JBO.17.12.126007. J Biomed Opt. 2012. PMID: 23208218 Free PMC article.
-
Direct measurement of the evanescent field profile produced by objective-based total internal reflection fluorescence.J Biomed Opt. 2006 Jan-Feb;11(1):014006. doi: 10.1117/1.2161018. J Biomed Opt. 2006. PMID: 16526883
-
Evanescent field shapes excitation profile under axial epi-illumination.J Biomed Opt. 2012 Jun;17(6):066021. doi: 10.1117/1.JBO.17.6.066021. J Biomed Opt. 2012. PMID: 22734777 Free PMC article.
-
Super-resolution measurements with evanescent-wave fluorescence excitation using variable beam incidence.J Biomed Opt. 2000 Jan;5(1):23-30. doi: 10.1117/1.429964. J Biomed Opt. 2000. PMID: 10938762 Review.
-
Imaging transmitter release. II. A practical guide to evanescent-wave imaging.Lasers Med Sci. 2001;16(3):159-70. doi: 10.1007/pl00011350. Lasers Med Sci. 2001. PMID: 11482813 Review.
Cited by
-
High performance, LED powered, waveguide based total internal reflection microscopy.Sci Rep. 2013;3:2133. doi: 10.1038/srep02133. Sci Rep. 2013. PMID: 23823601 Free PMC article.
-
Total internal reflection fluorescence quantification of receptor pharmacology.Biosensors (Basel). 2015 Apr 27;5(2):223-40. doi: 10.3390/bios5020223. Biosensors (Basel). 2015. PMID: 25922915 Free PMC article. Review.
-
Eliminating unwanted far-field excitation in objective-type TIRF. Part II. combined evanescent-wave excitation and supercritical-angle fluorescence detection improves optical sectioning.Biophys J. 2014 Mar 4;106(5):1044-56. doi: 10.1016/j.bpj.2013.12.051. Biophys J. 2014. PMID: 24606929 Free PMC article.
-
Single-molecule fluorescence characterization in native environment.Biophys Rev. 2010 Dec 1;2(4):159-167. doi: 10.1007/s12551-010-0038-z. Biophys Rev. 2010. PMID: 21179385 Free PMC article.
-
Mesoscopic analysis of motion and conformation of cross-bridges.Biophys Rev. 2012 Dec;4(4):299-311. doi: 10.1007/s12551-012-0074-y. Epub 2012 Apr 17. Biophys Rev. 2012. PMID: 28510208 Free PMC article. Review.
References
-
- Shaner NC, Steinbach PA, Tsien RY. A guide to choosing fluorescent proteins. Nature Methods. 2005;2:905–909. - PubMed
-
- Bobroff N. Position measurement with a resolution and noise-limited instrument. Rev. Sci. Instrum. 1986;57:1152–1157.
-
- Yildiz A, Forkey JN, McKinney SA, Ha T, Goldman YE, Selvin PR. Myosin V walks hand-over-hand: single fluorophore imaging with 1.5 nm localization. Science. 2003;300:2061–2065. - PubMed
-
- Ruckstuhl T, Seeger S. Attoliter detection volumes by confocal total-internal-reflection fluorescence microscopy. Opt. Lett. 2004;29:569–571. - PubMed
Publication types
MeSH terms
Grants and funding
LinkOut - more resources
Full Text Sources
Other Literature Sources
Miscellaneous

