. 2009 Dec 7;9(23):3364-9.
doi: 10.1039/b911882a. Epub 2009 Sep 30.

Rapid automated cell quantification on HIV microfluidic devices

Affiliations

Rapid automated cell quantification on HIV microfluidic devices

Mohamad A Alyassin et al. Lab Chip. .

Abstract

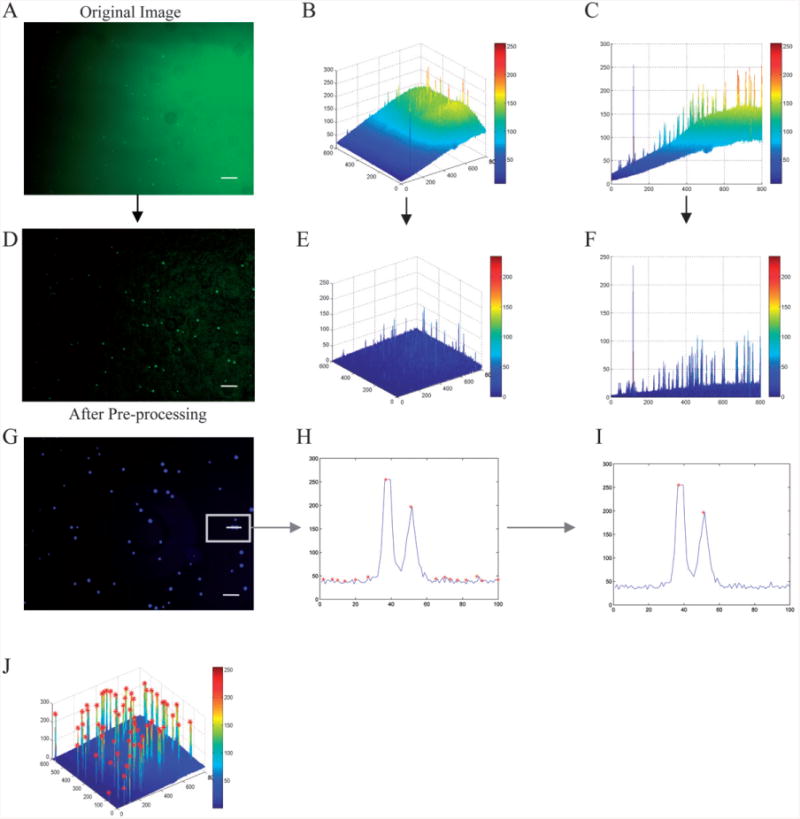
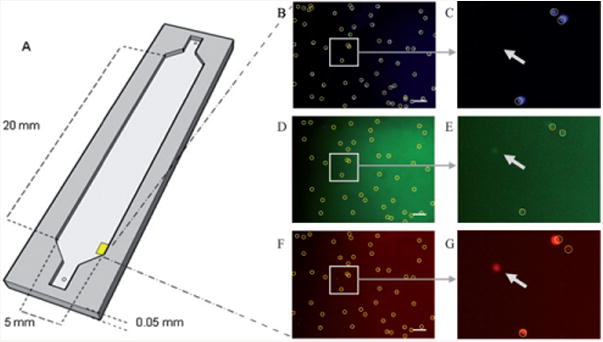
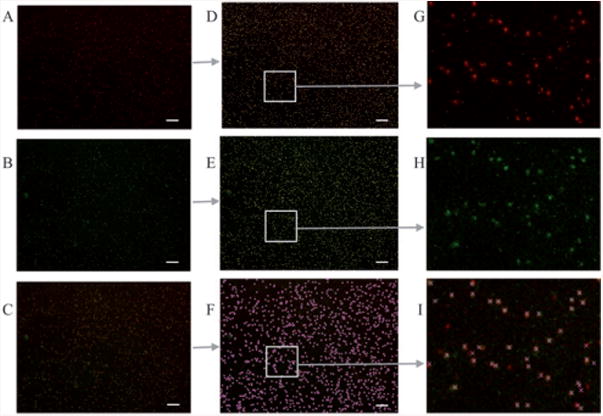
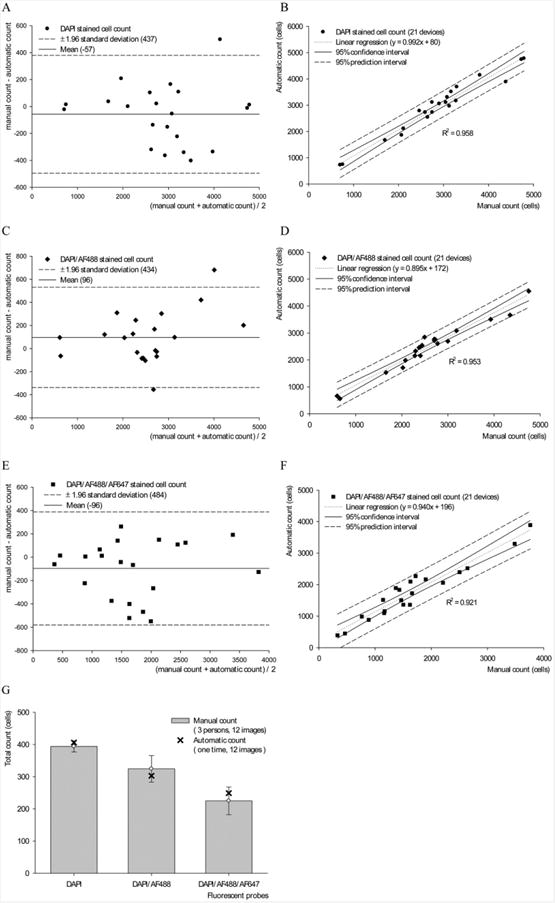
Lab-chip device analysis often requires high throughput quantification of fluorescent cell images, obtained under different conditions of fluorescent intensity, illumination, focal depth, and optical magnification. Many laboratories still use manual counting--a tedious, expensive process prone to inter-observer variability. The manual counting process can be automated for fast and precise data gathering and reduced manual bias. We present a method to segment and count cells in microfluidic chips that are labeled with a single stain, or multiple stains, using image analysis techniques in Matlab and discuss its advantages over manual counting. Microfluidic based cell capturing devices for HIV monitoring were used to validate our method. Captured CD4(+) CD3(+) T lymphocytes were stained with DAPI, AF488-anti CD4, and AF647-anti CD3 for cell identification. Altogether 4788 (76 x 3 x 21) gray color images were obtained from devices using discarded 10 HIV infected patient whole blood samples (21 devices). We observed that the automatic method performs similarly to manual counting for a small number of cells. However, automated counting is more accurate and more than 100 times faster than manual counting for multiple-color stained cells, especially when large numbers of cells need to be quantified (>500 cells). The algorithm is fully automatic for subsequent microscope images that cover the full device area. It accounts for problems that generally occur in fluorescent lab-chip cell images such as: uneven background, overlapping cell images and cell detection with multiple stains. This method can be used in laboratories to save time and effort, and to increase cell counting accuracy of lab-chip devices for various applications, such as circulating tumor cell detection, cell detection in biosensors, and HIV monitoring devices, i.e. CD4 counts.


Figures

Fig. 1
Fig. 1
Background subtraction and cell detection. The original image (A) is plotted in three dimensions (B). The image was viewed along the x-z axis (C), the background increases from <25 to >150 from left to right. The image was then processed (D) and plotted in three dimensions after background subtraction (E). It was also viewed along the x-z axis (F), the background was always <50 without losing signal intensity for the objects of interest (cells). Detecting a local maximum in the intensity profile across a portion of one image (G), all the local maxima were determined (H), a local thresholding method was then applied to the image to separate cells from background (I). Local maxima followed by local thresholding was applied to the image, shown in 3-D (J). In (B,E) the x-y axis labeling corresponds to pixels whereas the z axis labeling corresponds to intensity. In (C,F,H,I) the x axis labeling corresponds to pixels whereas the y axis labeling corresponds to intensity (8bit, 0∼255). The scale bar is 100 μm.
Fig. 2
Fig. 2
Drawing of the microfluidic device used to capture T lymphocytes using surface chemistry (A). Fluorescent images of cells stained with DAPI (B), CD4 (C), and CD3 (D). All cells in the DAPI image are marked. The DAPI image is used as a base for CD4 and CD3. The location of each cell in the DAPI image is compared to that in the processed CD4 and CD3 images. If a cell candidate in those images exceeds a certain threshold, the program marks it as a cell. The circle indicates what the program considers “a cell”; the arrows show objects that are not considered cells since they were not found in all three stains. Scale bar corresponds to 100 μm.
Fig. 3
Fig. 3
Cells in 4× images on microfluidic filters. Enumeration is often required for 4× images, more than 3000 cells per image, with over 1000 cells that fluoresce for both CD3 and CD4. (A,B) correspond to CD3+ and CD4+ stained cells, respectively. (C) is a merged image of A and B. (D,E,F) are counted versions of A, B, and C. (G,H,I) are the magnified portions of D, E, and F. Counting these images automatically takes 3–5 seconds. Manual counting of these highly populated images take 5 hours. Hence, in this case the automated method provides over 3000 times faster counting. Scale bar corresponds to 200 microns.
Fig. 4
Fig. 4
Statistical analysis of the automated and manual counts of DAPI, CD4+, and CD3+ stained images. Bland-Altman plot of the automated versus the manual count of DAPI+, DAPI+/CD4+ and DAPI+/CD4+/CD3+ cells, (A–C) showing the error and limit of agreement. Comparison using Passing and Bablok Regression is shown (E–G), with the 95% confidence interval and the regression equation. The variability of manual counting was obtained by having 3 counters counting the same 12 sets of images (D). We notice that the variability (error bars) increased when the task was to identify multiple stains; the automated count was within the standard deviation for all three cases. R values were 0.958, 0.954, and 0.921 for E, F, and G, respectively.

Similar articles

Cited by

References

    1. Nagrath S, et al. Isolation of rare circulating tumour cells in cancer patients by microchip technology. Nature. 2007;450:1235–1239. - PMC - PubMed
    1. Oh TI, Sung JH, Tatosian DA, Shuler ML, Kim D. Realtime fluorescence detection of multiple microscale cell culture analog devices in situ. Cytometry A. 2007;71:857–865. - PubMed
    1. Moon SJ, Lin R, Demirci U. CD4 + T-lymphocyte capture using a disposable microfluidic chip for HIV. J Vis Exp. 2007;315 - PMC - PubMed
    1. Moon SJ, Keles HO, Ozcan A, Khademhosseini A, Haeggstrom E, Kuritzkes DR, Demirci U. Integrating microfluidics and lensless imaging for point-of-care testing. Biosens Bioelectron. 2009 - PMC - PubMed
    1. Ozcan A, Demirci U. Ultra wide-field lens-free monitoring of cells on-chip. Lab Chip. 2008;8:98–106. - PubMed

Publication types

MeSH terms