. 2010 Apr;119(2):149-65.
doi: 10.1007/s00412-009-0244-2. Epub 2009 Nov 11.

Re-examination of siRNA specificity questions role of PICH and Tao1 in the spindle checkpoint and identifies Mad2 as a sensitive target for small RNAs

Affiliations

Re-examination of siRNA specificity questions role of PICH and Tao1 in the spindle checkpoint and identifies Mad2 as a sensitive target for small RNAs

Nadja C Hübner et al. Chromosoma. 2010 Apr.

Abstract

The DNA-dependent adenosine triphosphatase (ATPase) Plk1-interacting checkpoint helicase (PICH) has recently been implicated in spindle checkpoint (SAC) signaling (Baumann et al., Cell 128(1):101-114, 2007). Depletion of PICH by siRNA abolished the SAC and resulted in an apparently selective loss of Mad2 from kinetochores, suggesting a role for PICH in the regulation of the Mad1-Mad2 interaction. An apparent rescue of SAC functionality by overexpression of PICH in PICH-depleted cells initially seemed to confirm a role for PICH in the SAC. However, we have subsequently discovered that all PICH-directed siRNA oligonucleotides that abolish the SAC also reduce Mad2 mRNA and protein expression. This reduction is functionally significant, as PICH siRNA does not abolish SAC activity in a cell line that harbors a bacterial artificial chromosome driving the expression of murine Mad2. Moreover, we identified several siRNA duplexes that effectively deplete PICH but do not significantly affect SAC functionality or Mad2 abundance or localization. Finally, we discovered that the ability of overexpressed PICH to restore SAC activity in PICH-depleted cells depends on sequestration of the mitotic kinase Plk1 rather than ATPase activity of PICH, pointing to an underlying mechanism of "bypass suppression." In support of this view, depletion or inhibition of Plk1 also rescued SAC activity in cells harboring low levels of Mad2. This observation suggests that a reduction of Plk1 activity partially compensates for reduced Mad2 levels and argues that Plk1 normally reduces the strength of SAC signaling. Collectively, our results question the role of PICH in the SAC and instead identify Mad2 as a sensitive off target for small RNA duplexes. In support of the latter conclusion, our evidence suggests that an off-target effect on Mad2 may also contribute to explain the apparent role of the Tao1 kinase in SAC signaling.


Figures

Fig. 1
Fig. 1
Overexpression of PICH in PICH siRNA-treated cells restores mitotic timing. HeLa cells stably expressing histone H2B-GFP were transfected simultaneously with the indicated siRNA duplexes and plasmids and analyzed by time-lapse microscopy. mCherry-positive cells were analyzed to determine the average time from NEBD to anaphase onset. Left panels show single-plane images selected from movies, and time stamps indicate hours:minutes. Right panels show representative fate maps of 25 individual cells (the whole experiment being repeated independently three times), with red columns indicating the time span from NEBD to anaphase onset and blue columns indicating cells that died in interphase during imaging. Average times from NEBD to anaphase onset are indicated to the right
Fig. 2
Fig. 2
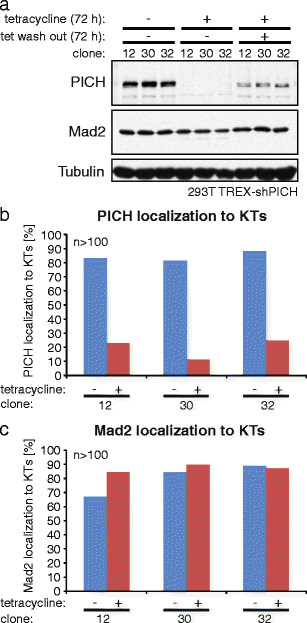
PICH is not essential for SAC activity in 293T TREX cells. After selection of three different clones (nos. 12, 30, 32) of 293T TREX cells allowing the inducible expression of a PICH-directed shRNA (modeled after PICH-1 siRNA), PICH levels were monitored by Western blotting. In parallel, KT localization of PICH and Mad2 was examined by immunofluorescence microscopy. a Three different clones (12, 30, and 32) of stably transfected 293T TREX-shPICH cells were analyzed by Western blotting for the expression of PICH and Mad2; α-Tubulin was monitored as a loading control. b Bar graph shows quantitative analysis of PICH localization to KTs before and after 72 h tetracycline induction (n > 100). c Bar graph shows quantitative analysis of Mad2 localization to KTs before and after 72 h tetracycline induction (n > 100)
Fig. 3
Fig. 3
LAP-mouse PICH fails to rescue PICH-1 siRNA phenotype. a Morphological examination of the nuclei of HeLa cells expressing LAP-mouse PICH after 48 h of siRNA treatment with GL2 or PICH-1 siRNA, respectively. DNA was visualized by DAPI staining. Bar indicates 10 μm. b Mitotic timing in siRNA-treated HeLa cells expressing LAP-mouse PICH. Cells were transfected with the indicated siRNA duplexes and analyzed by live-cell imaging. The bar graph indicates the average time from NEBD to anaphase onset. Data were collected from three experiments (20 cells each), and error bars indicate standard errors. c Cells were transfected with the indicated siRNA duplexes for 48 h and lysates probed by Western blotting with antibodies against PICH, GFP (to selectively visualize LAP-mouse PICH), Mad2, and α-Tubulin
Fig. 4
Fig. 4
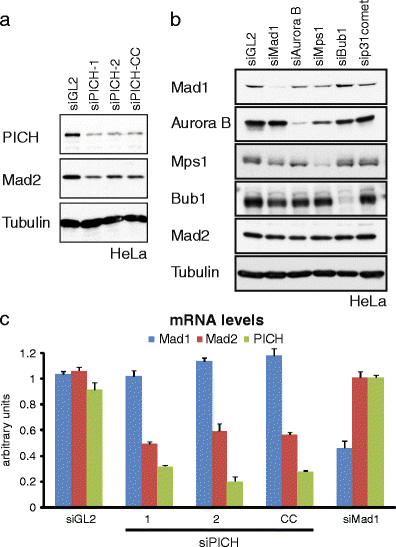
Effect of PICH siRNA treatment on Mad2 expression. a HeLa cells were transfected with the indicated siRNA duplexes and levels of PICH, Mad2, and α-Tubulin (loading control) were monitored by Western blotting. b For control, various checkpoint proteins were depleted by siRNA, as indicated, and protein levels determined by Western blotting. c HeLa cells were transfected with the indicated siRNAs and levels of Mad1, Mad2, and PICH mRNA were measured by qRT-PCR. Bar graphs show mRNA levels averaged from three independent experiments (arbitrary units, AU), and error bars represent standard errors
Fig. 5
Fig. 5
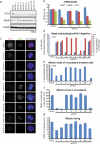
Analysis of depletion efficiencies and phenotypes produced by different PICH-directed siRNA duplexes. a HeLa cells were treated with indicated siRNAs before lysates were analyzed by Western blotting with the indicated antibodies. Note that Mad2 levels are reduced in response to siPICH-1, siPICH-2, and siPICH-CC (marked by asterisks). b HeLa cells were transfected with the indicated PICH siRNA oligonucleotides and arrested in thymidine prior to RNA purification and measurements of mRNA levels by qRT-PCR. Histogram illustrates relative mRNA levels of Mad1 (blue), Mad2 (red), and PICH (green; in AU). Note that Mad2 mRNA levels are significantly reduced in siPICH-1 and siPICH-CC (marked by asterisk). Error bars indicate standard errors (three independent experiments). c Cells were treated with different PICH-directed siRNAs and stained with antibodies directed against PICH (red) and Mad2 (green); DNA was stained with DAPI (blue). Note that Mad2 is displaced from KTs solely in response to siPICH-1, siPICH-2, or siPICH-CC oligonucleotides. d HeLa cells were treated as in c, and Mad2 mislocalization (displacement from KTs) was counted. The graph shows the percentage of mitotic cells that were depleted of PICH (red bars) as well as the percentage of cells showing mislocalization of Mad2 (blue bars); (n = 50). e Following a 24 h thymidine block, HeLa cells were released for 16 h into nocodazole, and the percentage of mitotic cells was determined by visual inspection after DAPI staining. Graph shows the average from two independent experiments (n = 300). f Histogram summarizes the results of live-cell time-lapse microscopy performed on cells that had been depleted of PICH by 48 h treatments with different PICH-directed siRNA duplexes and then treated with nocodazole during the last 16 h. Error bars indicate standard errors (n = 40). g HeLa cells stably expressing H2B-GFP were transfected with the indicated siRNAs and analyzed by live-cell imaging. The histogram illustrates the elapsed average time from NEBD to anaphase onset (40 cells for each treatment), and error bars indicate standard errors
Fig. 6
Fig. 6
Evaluation of protein knockdown efficiency, Mad2 localization, and SAC phenotype for different siRNA oligonucleotides targeting Tao1 kinase. a HeLa cells were transfected with the indicated siRNA duplexes, and lysates were probed by Western blotting with the indicated antibodies. Asterisks indicate the reduction of Mad2 levels by some but not all Tao1 and PICH-directed siRNAs. b Three independent experiments were performed as in a, and Western blots were used for quantification of Mad2 and Tao1 protein levels. Band intensities were measured using the Aida Image Analyzer software. The histograms show the mean band intensities normalized against background and α-Tubulin, and error bars indicate standard errors. Note that Mad2 protein levels were significantly reduced in lysates from siPICH-1-, siPICH-CC-, and siTao1-NCB3-treated cells (marked by asterisks). c Cells were treated with different Tao1-directed siRNAs and stained with antibodies directed against Mad2 (red); DNA was stained with DAPI (blue). Scale bar indicates 5 µm. Note that Mad2 is displaced from KTs only in response to Tao1-NCB3, but not other Tao1-directed duplexes. d Quantitative analysis of Mad2 localization in cells depleted of Tao1. HeLa cells were treated as described in c. The graph shows the percentage of prometaphase cells in which Mad2 localizes correctly to KTs; shown are the averages from three independent experiments with standard errors (n > 150).
Fig. 7
Fig. 7
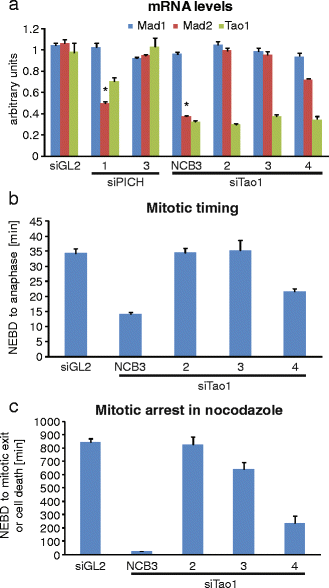
Histogram illustrating mRNA levels, mitotic timing, and nocodazole response after Tao1-directed siRNA. a After treatment of HeLa cells with the indicated siRNAs, RNA was extracted for qRT-PCR measurements. Bars indicate relative mRNA expression levels of Mad1 (blue), Mad2 (red), and Tao1 (green; in AU); shown are averages from three independent experiments and standard errors. Significant reduction of Mad2 mRNA in PICH-1 and Tao1-NCB3 siRNA-treated cells is marked by asterisks. b HeLa cells stably expressing H2B-GFP were transfected with the indicated siRNAs and analyzed by live-cell imaging. The histogram illustrates the elapsed average time from NEBD to anaphase onset (40 cells for each treatment), and error bars indicate standard errors. c Histogram summarizes the results of live-cell time-lapse microscopy performed on cells that had been depleted of Tao1 by 48-h treatments with different Tao1-directed siRNA duplexes and then treated with nocodazole during the last 16 h. Error bars indicate standard errors (n = 40)
Fig. 8
Fig. 8
Rescue of PICH-1 and Tao1 siRNA phenotypes by LAP-mouse Mad2. a Mitotic timing in siRNA-treated HeLa cells expressing LAP-mouse Mad2. Cells were transfected for 48 h with the indicated siRNA duplexes and analyzed by live-cell imaging. In these experiments, GFP-positive cells (expressing mouse Mad2) and GFP-negative cells (not expressing mouse Mad2) were monitored in parallel. The bar graph indicates the average time from NEBD to anaphase onset. Data were collected from four experiments (20–25 cells each), and error bars indicate standard errors. b Lysates were prepared from cells treated as in a and analyzed by Western blotting with the indicated antibodies. The lane to the right represents a lysate prepared from the parental HeLa (Kyoto) cell line that lacks the BAC expressing murine Mad2. Asterisk denotes a cross-reactive band that serves as loading control
Fig. 9
Fig. 9
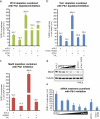
Analysis of overexpressed PICH mutants for their ability to restore mitotic timing in PICH-1 siRNA-treated cells. a mCherry-PICH WT (shown in Fig. 1), mCherry-PICH-K128A (defective in ATPase activity), and mCherry-PICH-T1063A were cotransfected with PICH-1 siRNA oligonucleotide into H2B-GFP-expressing HeLa cells before these were analyzed by live-cell imaging (as described in the legend to Fig. 1). mCherry-positive cells were analyzed to determine the average time from NEBD to anaphase onset. Left panels show single-plane images selected from movies and time stamps indicate hours:minutes. Right panels show representative fate maps of 25 individual cells (the whole experiment being repeated independently three times), with red columns indicating the time span from NEBD to anaphase onset and blue columns indicating cells that died in interphase during imaging. Average times from NEBD to anaphase onset are indicated to the right. b Quantification of overexpression of mCherry-PICH WT, mCherry-PICH K128A, and mCherry-PICH T1063A in comparison to endogenous PICH. HeLa cells were transfected with the indicated plasmids as in a, and total cell lysates were subjected to serial dilutions before Western blotting with anti-PICH antibody. Transfection efficiency (indicated to the right) was determined by immunofluorescence staining using anti-mCherry antibody, and fold overexpression was calculated, taking into account the dilution factor and the transfection efficiency. This experiment indicates that the mCherry-PICH constructs were similarly overexpressed (about 20–24-fold) when compared to endogenous PICH levels
Fig. 10
Fig. 10
Codepletion of PICH and Plk1 restores SAC activity. ac HeLa cells stably expressing H2B-GFP were subjected to single and double depletion (PICH, Tao1, Mad2, Plk1) or inhibition (Plk1) experiments, as described in each panel, and analyzed by time-lapse microscopy. Histograms illustrate the mitotic timing from NEBD to mitotic exit or cell death. Error bars represent standard error (n = 40). d Western blot analysis of Mad2 abundance after transfection of HeLa cells with increasing concentrations of Mad2 siRNA duplex (0.06, 1.2, 3.2, 6.6, 20 pM) and PICH-1, Tao1-NCB3, and GL2 siRNA for comparison. α-Tubulin serves as loading control. e HeLa cells stably expressing H2B-GFP were transfected with increasing amounts of Mad2 siRNA (as described in d) as well as PICH-1 and Tao1-NCB3 duplexes, prior to synchronization with thymidine and release into 1 µM TAL-containing medium. Then, the mitotic timing from NEBD to anaphase onset was determined by live-cell imaging. Histograms illustrate the results from three independent experiments (n = 20 for each experiment), and error bars represent standard error
Fig. 11
Fig. 11
Alignment of PICH and Tao1 siRNA sequences with Mad2 mRNA. The alignments were performed using the global EMBOSS pairwise Alignment Algorithm (http://www.ebi.ac.uk/Tools/emboss/align) with a gap open of 50.0, and the Mad2 RNA accession number NM_002358.3. The most extensive match observed for each oligonucleotide is shown. Alignments colored in red or green refer to siRNA duplexes that do or do not lower Mad2 transcripts, respectively

Similar articles

Cited by

References

    1. Bachrati CZ, Hickson ID. RecQ helicases: guardian angels of the DNA replication fork. Chromosoma. 2008;117(3):219–233. doi: 10.1007/s00412-007-0142-4. - DOI - PubMed
    1. Baumann C, Korner R, Hofmann K, Nigg EA. PICH, a centromere-associated SNF2 family ATPase, is regulated by Plk1 and required for the spindle checkpoint. Cell. 2007;128(1):101–114. doi: 10.1016/j.cell.2006.11.041. - DOI - PubMed
    1. Chan KL, North PS, Hickson ID. BLM is required for faithful chromosome segregation and its localization defines a class of ultrafine anaphase bridges. Embo J. 2007;26(14):3397–3409. doi: 10.1038/sj.emboj.7601777. - DOI - PMC - PubMed
    1. Chan KL, Palmai-Pallag T, Ying S, Hickson ID. Replication stress induces sister-chromatid bridging at fragile site loci in mitosis. Nat Cell Biol. 2009;11(6):753–760. doi: 10.1038/ncb1882. - DOI - PubMed
    1. Ditchfield C, Johnson VL, Tighe A, Ellston R, Haworth C, Johnson T, Mortlock A, Keen N, Taylor SS. Aurora B couples chromosome alignment with anaphase by targeting BubR1, Mad2, and Cenp-E to kinetochores. J Cell Biol. 2003;161(2):267–280. doi: 10.1083/jcb.200208091. - DOI - PMC - PubMed

Publication types

MeSH terms