

A task-specific assessment of Swine worker exposure to airborne dust
- PMID: 19904655
- PMCID: PMC10466474
- DOI: 10.1080/15459620903327970
A task-specific assessment of Swine worker exposure to airborne dust
Abstract
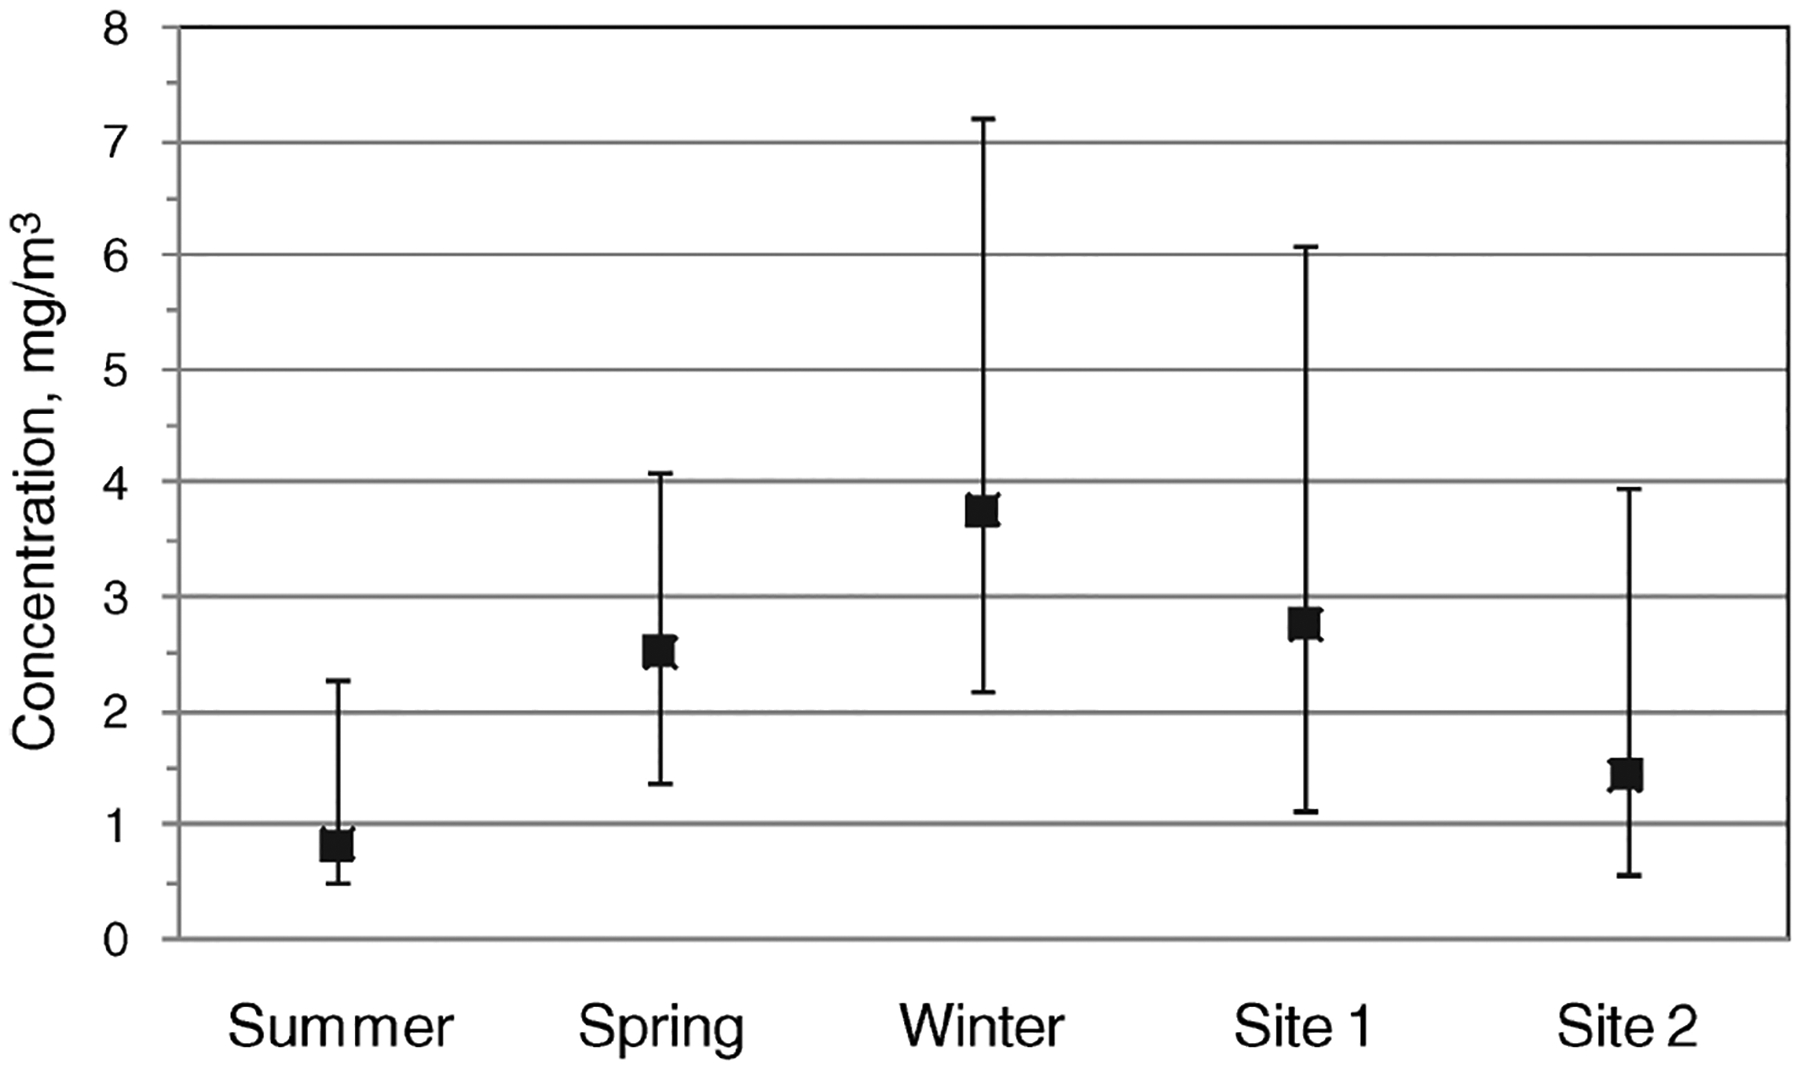
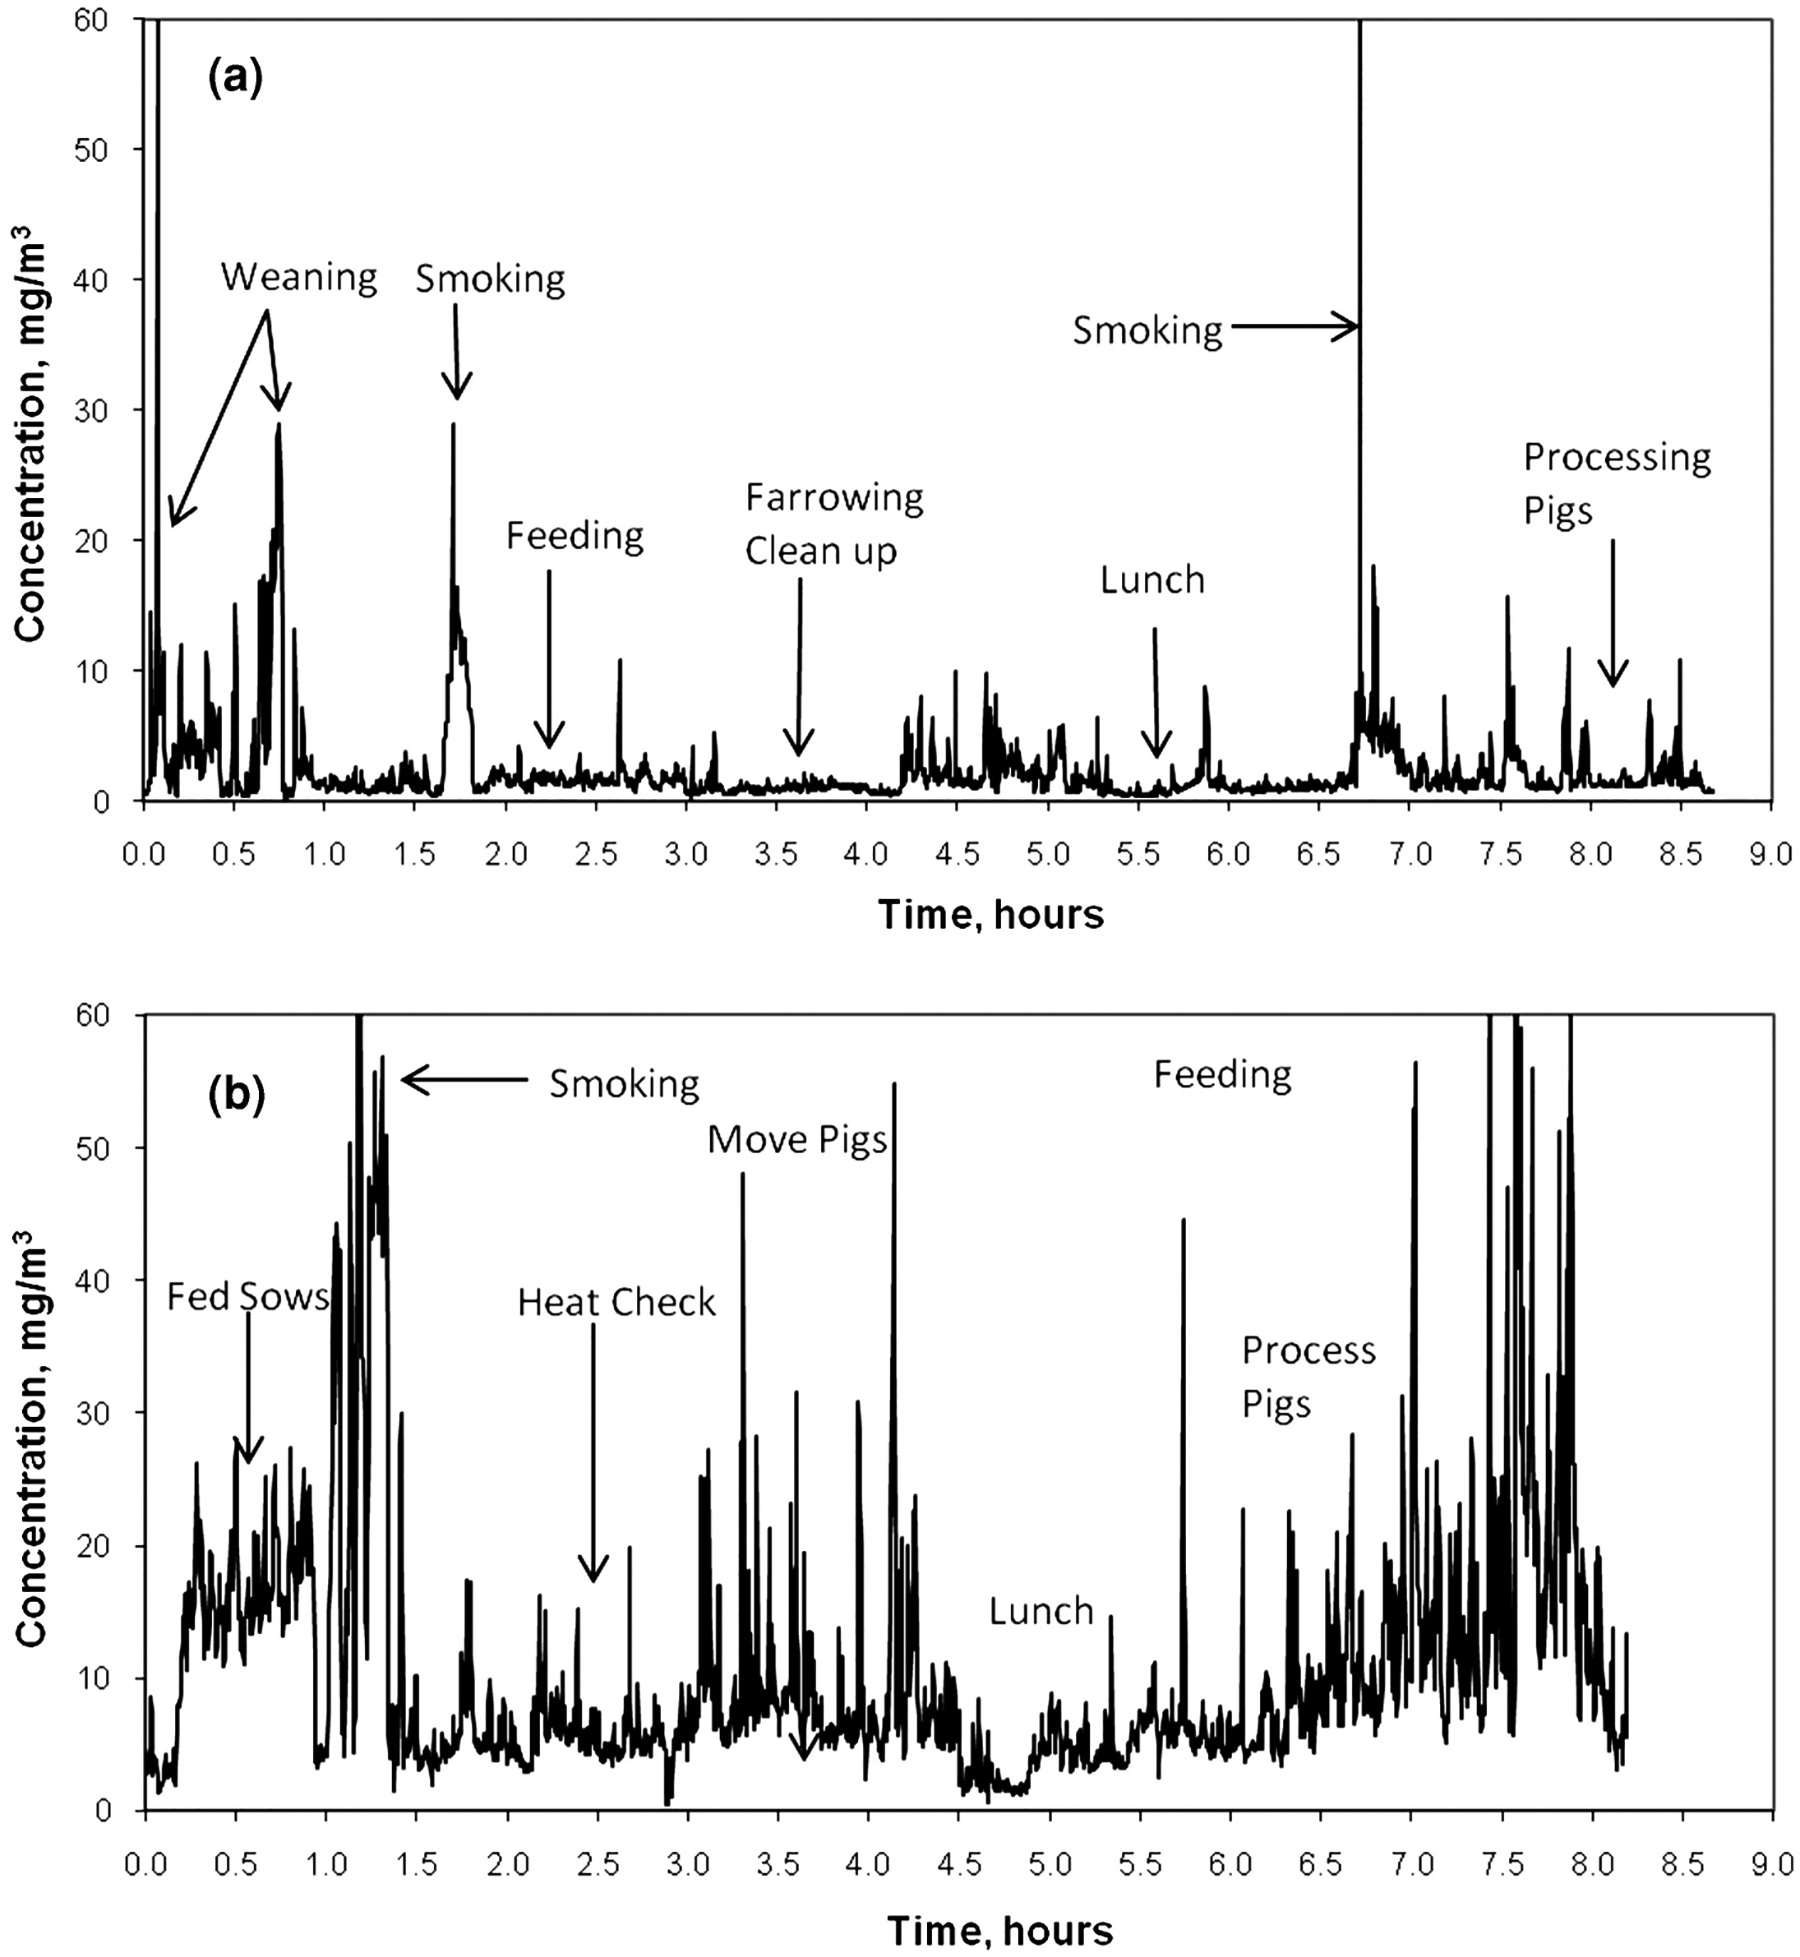
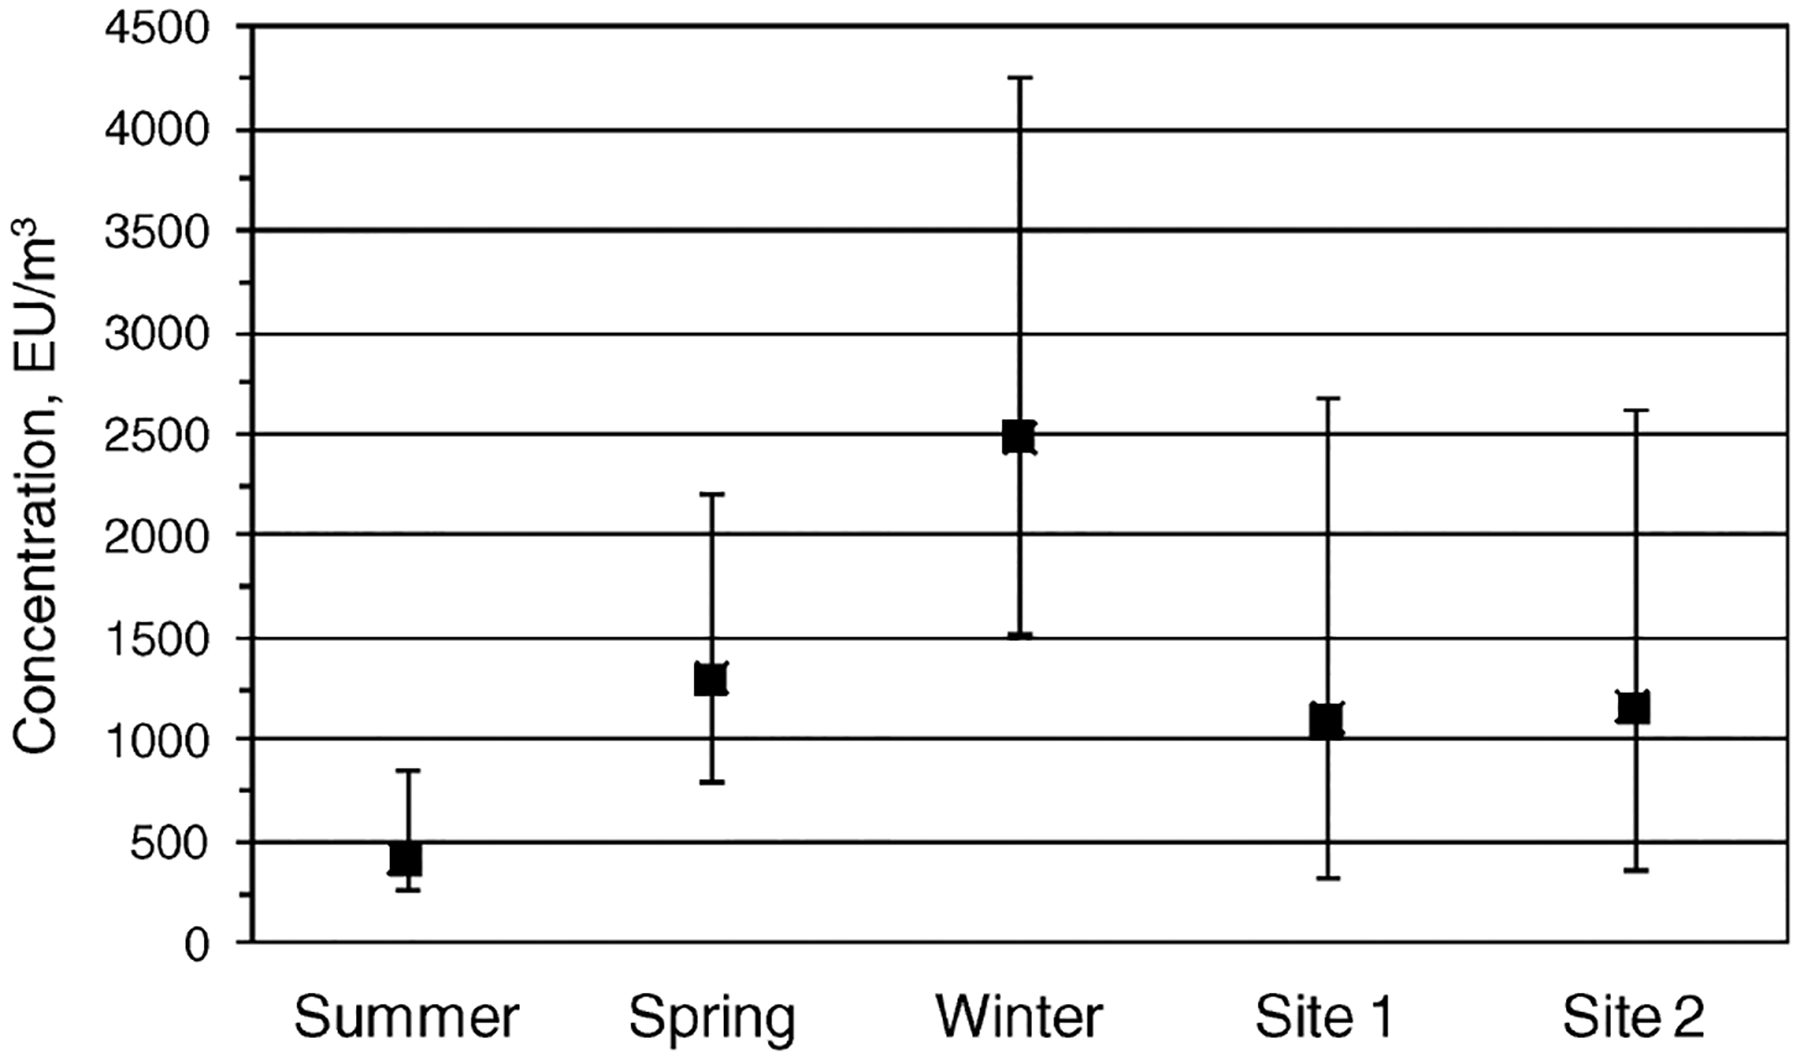
A task-based analysis of personal airborne dust exposures was performed in two swine confinement facilities used to house sows and their litters. Airborne particulate levels were assessed during summer, winter, and spring. Personal aerosol measurements of workers were made with a photometer every 15 sec and corrected to compare with an integrated concentration measurement made with a co-located IOM inhalable dust sampler. Task type and time period were recorded by the workers over an 8-hr work shift. There was a significant difference in dust concentrations between seasons (p < 0.001), with winter months providing the highest levels (geometric mean = 3.76 mg/m(3)). The application of a general linear model of log-transformed task concentrations relative to site, season, and task demonstrated significant differences (P < 0.001) among all three covariates. Tasks performed near moving animals, especially the weaning process, resulted in the greatest concentrations. These results indicate the need to evaluate the concentration levels for separate tasks during multi-task work shifts, such as swine rearing, to optimize efforts to minimize exposures by focusing on high-concentration tasks.
Figures
Similar articles
-
A comprehensive review of levels and determinants of personal exposure to dust and endotoxin in livestock farming.J Expo Sci Environ Epidemiol. 2015 Mar-Apr;25(2):123-37. doi: 10.1038/jes.2013.83. Epub 2013 Nov 27. J Expo Sci Environ Epidemiol. 2015. PMID: 24280684 Review.
-
Dust, endotoxin, fungi, and bacteria exposure as determined by work task, season, and type of plant in a flower greenhouse.Ann Occup Hyg. 2015 Mar;59(2):142-57. doi: 10.1093/annhyg/meu090. Epub 2014 Nov 10. Ann Occup Hyg. 2015. PMID: 25389370
-
Major environmental characteristics of swine husbandry that affect exposure to dust and airborne endotoxins.J Toxicol Environ Health A. 2019;82(4):233-243. doi: 10.1080/15287394.2019.1584596. Epub 2019 Mar 1. J Toxicol Environ Health A. 2019. PMID: 30821635
-
Exposure to inhalable dust and endotoxin among Danish pig farmers affected by work tasks and stable characteristics.Ann Occup Hyg. 2013 Oct;57(8):1005-19. doi: 10.1093/annhyg/met029. Epub 2013 Jun 22. Ann Occup Hyg. 2013. PMID: 23792973
-
Exposure to grain dust in Great Britain.Ann Occup Hyg. 2012 Jan;56(1):25-36. doi: 10.1093/annhyg/mer084. Epub 2011 Oct 5. Ann Occup Hyg. 2012. PMID: 21976307 Review.
Cited by
-
Simulation of air quality and cost to ventilate swine farrowing facilities in winter.Comput Electron Agric. 2013 Oct;98:136-145. doi: 10.1016/j.compag.2013.08.003. Epub 2013 Aug 30. Comput Electron Agric. 2013. PMID: 26937062 Free PMC article.
-
Assessment of swine worker exposures to dust and endotoxin during hog load-out and power washing.Ann Occup Hyg. 2012 Aug;56(7):843-51. doi: 10.1093/annhyg/mes013. Epub 2012 Mar 16. Ann Occup Hyg. 2012. PMID: 22425653 Free PMC article.
-
Wintertime factors affecting contaminant distribution in a swine farrowing room.J Occup Environ Hyg. 2013;10(6):287-96. doi: 10.1080/15459624.2013.777303. J Occup Environ Hyg. 2013. PMID: 23548103 Free PMC article.
-
Survey of occupational hazards in Minnesota veterinary practices in 2012.J Am Vet Med Assoc. 2016 Jan 15;248(2):207-18. doi: 10.2460/javma.248.2.207. J Am Vet Med Assoc. 2016. PMID: 26720089 Free PMC article.
-
A comprehensive review of levels and determinants of personal exposure to dust and endotoxin in livestock farming.J Expo Sci Environ Epidemiol. 2015 Mar-Apr;25(2):123-37. doi: 10.1038/jes.2013.83. Epub 2013 Nov 27. J Expo Sci Environ Epidemiol. 2015. PMID: 24280684 Review.
References
-
- “Swine 2000, Part IV: Changes in the U.S. Pork Industry, 1990–2000.” [Online] Available at http://www.aphis.usda.gov/vs/ceah/ncahs/nahms/ swine/swine2000/swine2kPt... (Accessed March 13, 2009).
-
- Von Essen S, and Donham K: Illness and injury in animal confinement workers. Occup. Med 14(2):337–350 (1999). - PubMed
-
- Donham KJ, Popendorf W, Palmgren U, and Larsson L: Characterization of dusts collected from swine confinement buildings. Am. J. Ind. Med 10:294–297 (1986). - PubMed
-
- Donham KJ, Yeggy J, and Dague R: Production rates of toxic gases from liquid swine manure: Health implication for workers and animals in swine confinement buildings. Biological Wastes 24:161–173 (1988).
-
- Donham KJ, and Popendorf WJ: Ambient levels of selected gases inside swine confinement buildings. Am. Ind. Hyg. Assoc. J 46:658–661 (1985). - PubMed
Publication types
MeSH terms
Substances
Grants and funding
LinkOut - more resources
Full Text Sources
Medical