. 2010 Jan;19(1):66-74.
doi: 10.1002/pro.283.

Structural differences between apolipoprotein E3 and E4 as measured by (19)F NMR

Affiliations

Structural differences between apolipoprotein E3 and E4 as measured by (19)F NMR

Kanchan Garai et al. Protein Sci. 2010 Jan.

Abstract

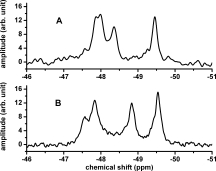
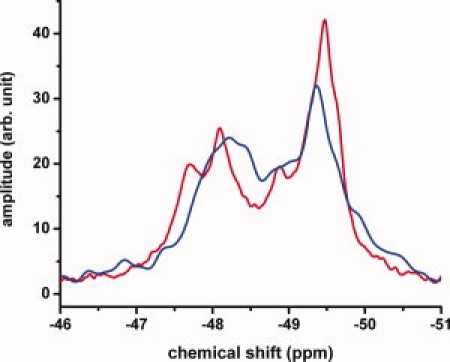
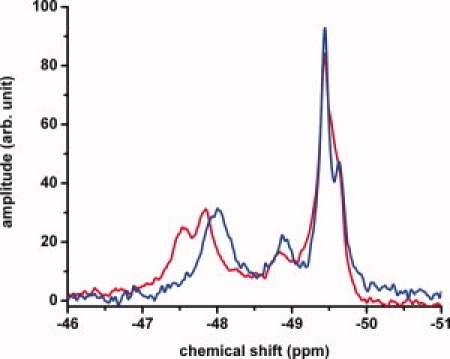
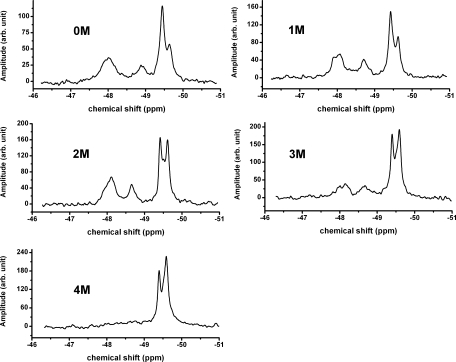
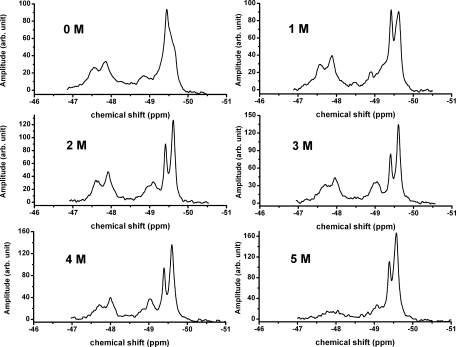
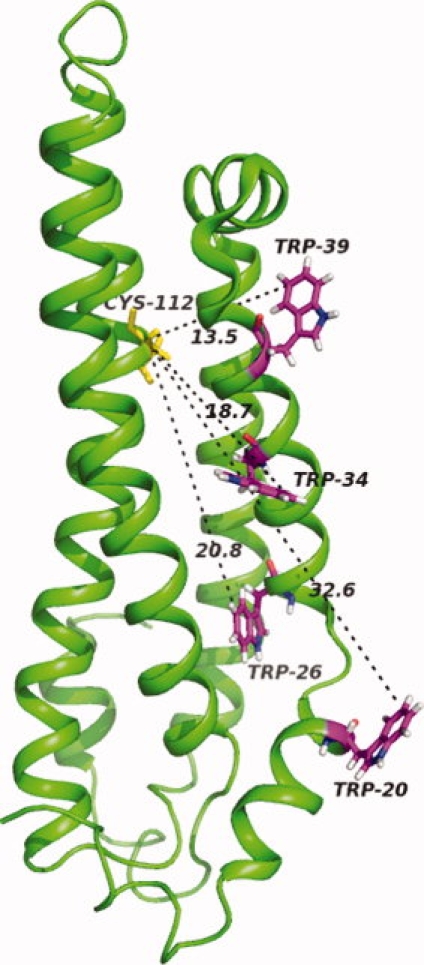
The apolipoprotein E family contains three major isoforms (ApoE4, E3, and E2) that are directly involved with lipoprotein metabolism and cholesterol transport. ApoE3 and apoE4 differ in only a single amino acid with an arginine in apoE4 changed to a cysteine at position 112 in apoE3. Yet only apoE4 is recognized as a risk factor for Alzheimer's disease. Here we used (19)F NMR to examine structural differences between apoE4 and apoE3 and the effect of the C-terminal domain on the N-terminal domain. After incorporation of 5-(19)F-tryptophan the 1D (19)F NMR spectra were compared for the N-terminal domain and for the full length proteins. The NMR spectra of the N-terminal region (residues 1-191) are reasonably well resolved while those of the full length wild-type proteins are broad and ill-defined suggesting considerable conformational heterogeneity. At least four of the seven tryptophan residues in the wild type protein appear to be solvent exposed. NMR spectra of the wild-type proteins were compared to apoE containing four mutations in the C-terminal region that gives rise to a monomeric form either of apoE3 under native conditions (Zhang et al., Biochemistry 2007; 46: 10722-10732) or apoE4 in the presence of 1 M urea. For either wild-type or mutant proteins the differences in tryptophan resonances in the N-terminal region of the protein suggest structural differences between apoE3 and apoE4. We conclude that these differences occur both as a consequence of the Arg158Cys mutation and as a consequence of the interaction with the C-terminal domain.


Figures

Figure 1
Figure 1
19F NMR spectrum of N-terminal domain (residues 1-191) of (A) wt-apoE4 and (B) wt-apoE3. Data collected at 22°C in 20 mM HEPES, 80 mM NaCl, 0.1% βME at pH 7.4. The protein concentrations were 30 μM. The peaks at −48.4 ppm in A and −48.9 ppm in B are assigned to Trp39 [see Supporting Information Fig. 1(A)].
Figure 2
Figure 2
19F NMR spectrum of wt-apoE4 (blue) and wt-apoE3 (red). Data collected at 22°C in 20 mM HEPES, 80 mM NaCl, 0.1% βME at pH 7.4. The protein concentration was 50 μM. For comparison the spectra were normalized to the same total intensity under the peaks.
Figure 3
Figure 3
19F NMR spectrum of apoE4-C-terminal mutant (blue) and apoE3-C-terminal mutant (red). Experiments performed using 60 μM apoE mutants in 20 mM HEPES, 80 mM NaCl, 0.1% βME and pH 7.4. For comparison, the spectra were normalized to the same total intensity under the peaks.
Figure 4
Figure 4
Urea denaturation of apoE mutants measured by circular dichroism at 222 nm. The normalized unfolded fraction of apoE has been plotted as a function of urea concentrations for wt-apoE4 (▪), the C-terminal mutant of apoE4 (▴), wt-apoE3 (★) and the C-terminal mutant of apoE3 (•). The solid lines are fits of the data with a two state model. Experiments performed with 2–3 μM of apoE in 20 mM phosphate, 0.1% βME at pH 7.4 and 22°C at each urea concentration.
Figure 5
Figure 5
Urea denaturation of the apoE4-C-terminal mutant. Experiments performed in 20 mM HEPES, 80 mM NaCl, 0.1% βME at pH 7.4 and 22 °C. A 10 M stock urea solution in 20 mM Hepes buffer, pH 7.4 was added to the solution in appropriate amounts to make 1, 2, 3, 4, and 5 M urea solutions. The protein concentration at 0 M urea was 60 μM. The data shown are corrected for dilution.
Figure 6
Figure 6
Urea denaturation of the apoE3-C-terminal mutant. Experiments performed in 20 mM HEPES, 80 mM NaCl, 0.1% βME at pH 7.4 and 22°C. A 10 M stock urea solution in 20 mM Hepes buffer, pH 7.4 was added to the solution in appropriate amounts to make 1, 2, 3, and 4 M urea solutions. The protein concentration at 0 M urea was 60 μM. The data shown are corrected for dilution.
Figure 7
Figure 7
NMR structure of the N-terminal domain of wt-ApoE3 (PDB: 2KC3). Distances from the Cys112 to the 5′ position of Trp20, 26, 34, and 39 are shown in Å. Figure made using Pymol (DeLano, W.L. The PyMOL Molecular Graphics System, 2002, http://www.pymol.org).

Similar articles

Cited by

References

    1. Aggerbeck LP, Wetterau JR, Weisgraber KH, Wu CS, Lindgren FT. Human apolipoprotein E3 in aqueous solution. II. Properties of the amino- and carboxyl-terminal domains. J Biol Chem. 1988;263:6249–6258. - PubMed
    1. Chou CY, Lin YL, Huang YC, Sheu SY, Lin TH, Tsay HJ, Chang GG, Shiao MS. Structural variation in human apolipoprotein E3 and E4: secondary structure, tertiary structure, and size distribution. Biophys J. 2005;88:455–466. - PMC - PubMed
    1. Hatters DM, Peters-Libeu CA, Weisgraber KH. Apolipoprotein E structure: insights into function. Trends Biochem Sci. 2006;31:445–454. - PubMed
    1. Perugini MA, Schuck P, Howlett GJ. Self-association of human apolipoprotein E3 and E4 in the presence and absence of phospholipid. J Biol Chem. 2000;275:36758–36765. - PubMed
    1. Yokoyama S, Kawai Y, Tajima S, Yamamoto A. Behavior of human apolipoprotein E in aqueous solutions and at interfaces. J Biol Chem. 1985;260:16375–16382. - PubMed

Publication types

MeSH terms

LinkOut - more resources