

Computational analysis of the tether-pulling experiment to probe plasma membrane-cytoskeleton interaction in cells
- PMID: 19905340
- PMCID: PMC4990357
- DOI: 10.1103/PhysRevE.80.041905
Computational analysis of the tether-pulling experiment to probe plasma membrane-cytoskeleton interaction in cells
Abstract
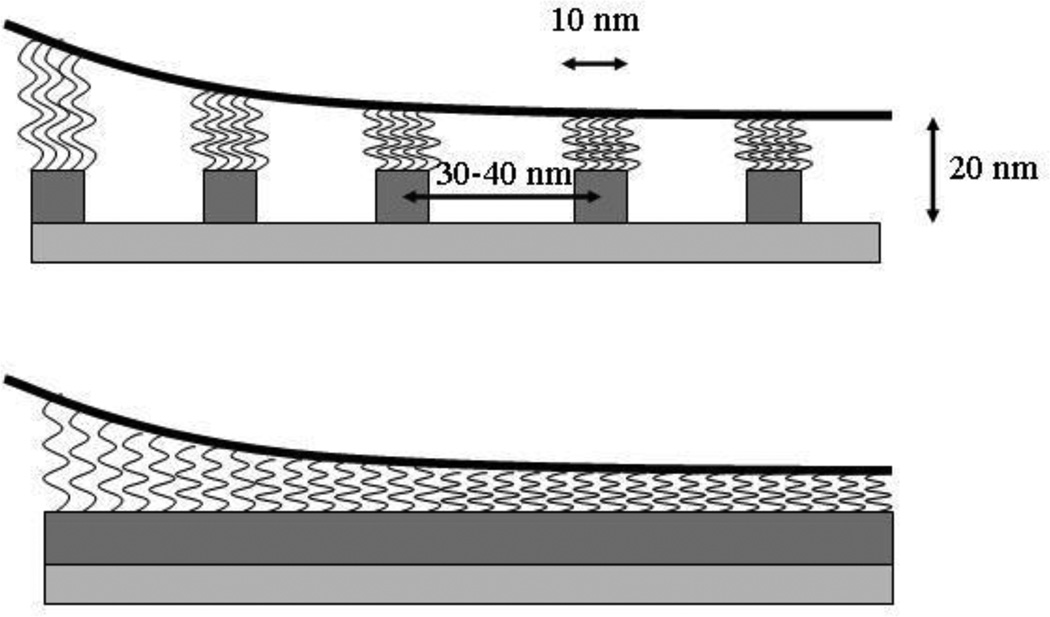
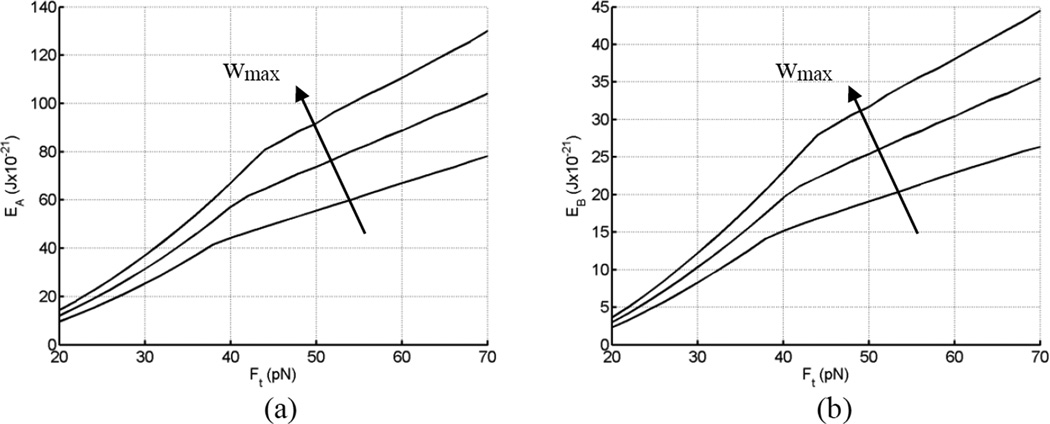
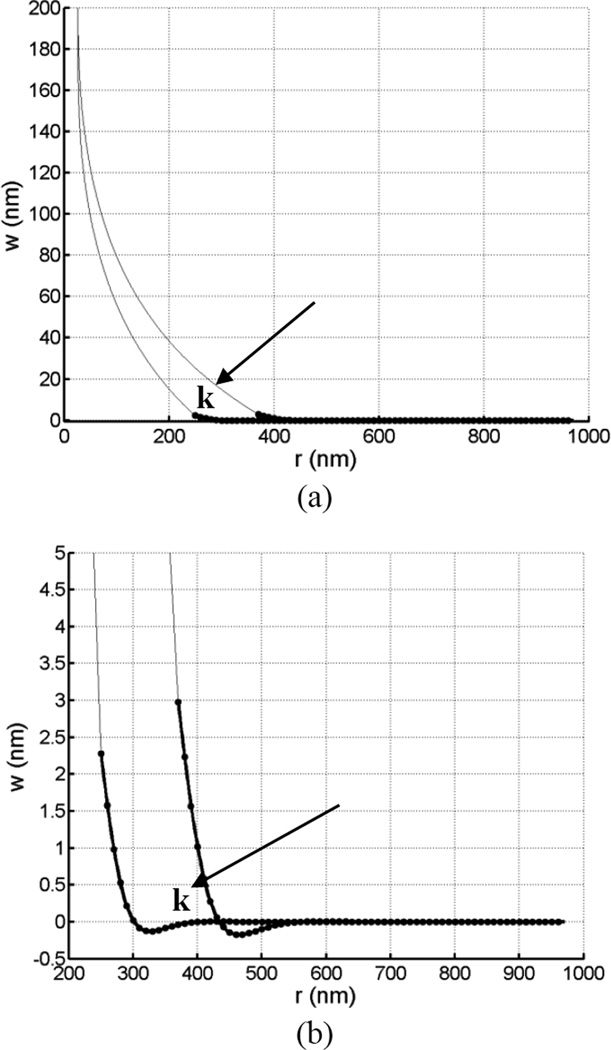
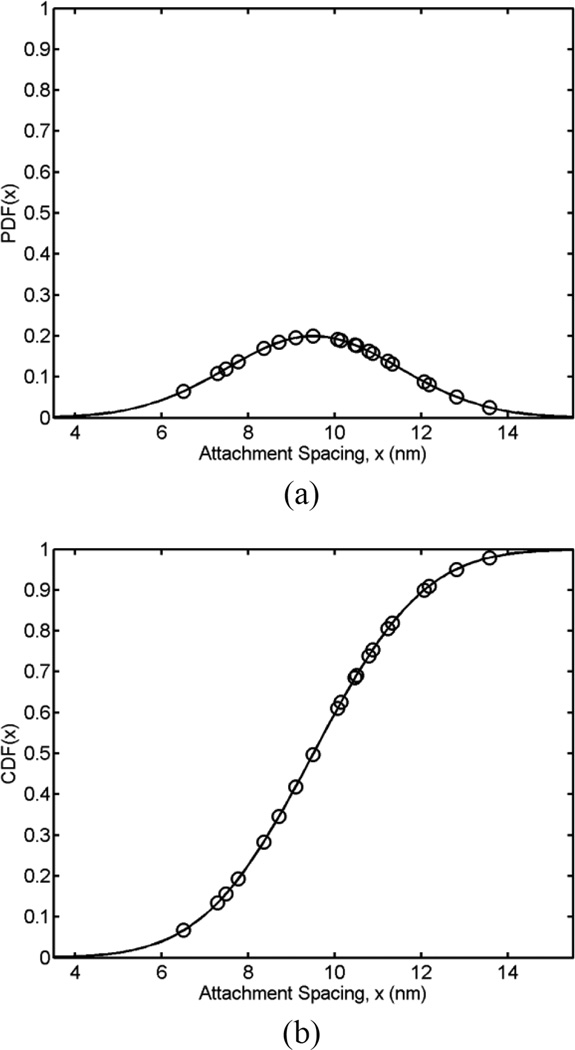
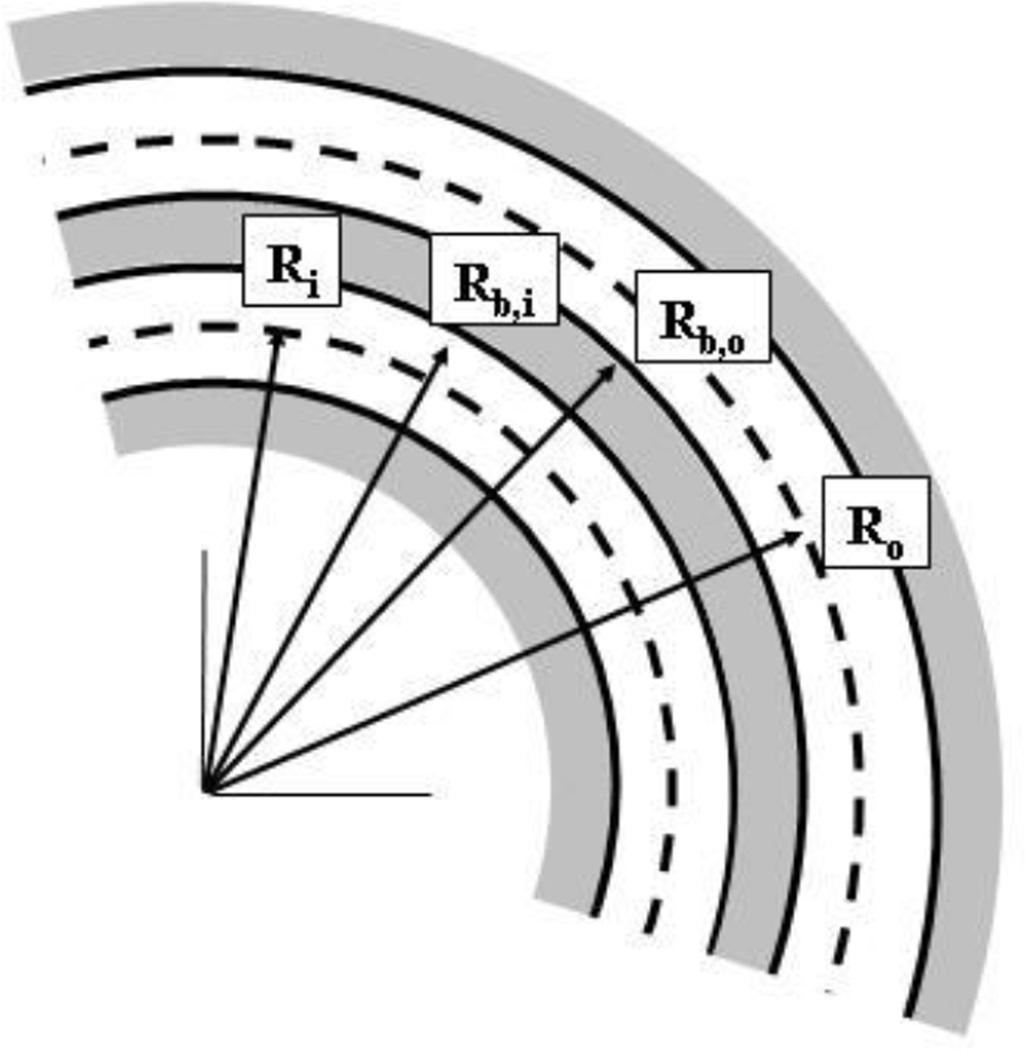
Tethers are thin membrane tubes that can be formed when relatively small and localized forces are applied to cellular membranes and lipid bilayers. Tether pulling experiments have been used to better understand the fine membrane properties. These include the interaction between the plasma membrane and the underlying cytoskeleton, which is an important factor affecting membrane mechanics. We use a computational method aimed at the interpretation and design of tether pulling experiments in cells with a strong membrane-cytoskeleton attachment. In our model, we take into account the detailed information in the topology of bonds connecting the plasma membrane and the cytoskeleton. We compute the force-dependent piecewise membrane deflection and bending as well as modes of stored energy in three major regions of the system: body of the tether, membrane-cytoskeleton attachment zone, and the transition zone between the two. We apply our method to three cells: cochlear outer hair cells (OHCs), human embryonic kidney (HEK) cells, and Chinese hamster ovary (CHO) cells. OHCs have a special system of pillars connecting the membrane and the cytoskeleton, and HEK and CHO cells have the membrane-cytoskeleton adhesion arrangement via bonds (e.g., PIP2), which is common to many other cells. We also present a validation of our model by using experimental data on CHO and HEK cells. The proposed method can be an effective tool in the analyses of experiments to probe the properties of cellular membranes.
Figures


Similar articles
-
Modeling the mechanics of tethers pulled from the cochlear outer hair cell membrane.J Biomech Eng. 2008 Jun;130(3):031007. doi: 10.1115/1.2907758. J Biomech Eng. 2008. PMID: 18532856
-
Structural Rearrangements in CHO Cells After Disruption of Individual Cytoskeletal Elements and Plasma Membrane.Cell Biochem Biophys. 2015 Apr;71(3):1605-13. doi: 10.1007/s12013-014-0383-9. Cell Biochem Biophys. 2015. PMID: 25395197
-
Effects of salicylate on plasma membrane mechanics.J Neurophysiol. 2005 Sep;94(3):2105-10. doi: 10.1152/jn.00414.2005. Epub 2005 Jun 15. J Neurophysiol. 2005. PMID: 15958599
-
Biomechanics of Neutrophil Tethers.Life (Basel). 2021 May 31;11(6):515. doi: 10.3390/life11060515. Life (Basel). 2021. PMID: 34073130 Free PMC article. Review.
-
The significance of the calcium signal in the outer hair cells and its possible role in tinnitus of cochlear origin.Eur Arch Otorhinolaryngol. 2004 Nov;261(10):517-25. doi: 10.1007/s00405-004-0745-9. Epub 2004 Sep 29. Eur Arch Otorhinolaryngol. 2004. PMID: 15609110 Review.
Cited by
-
Primary cilium: a paradigm for integrating mathematical modeling with experiments and numerical simulations in mechanobiology.Math Biosci Eng. 2021 Jan 15;18(2):1215-1237. doi: 10.3934/mbe.2021066. Math Biosci Eng. 2021. PMID: 33757184 Free PMC article.
-
Constitutively active ezrin increases membrane tension, slows migration, and impedes endothelial transmigration of lymphocytes in vivo in mice.Blood. 2012 Jan 12;119(2):445-53. doi: 10.1182/blood-2011-07-368860. Epub 2011 Nov 21. Blood. 2012. PMID: 22106344 Free PMC article.
-
Dynamics of the primary cilium in shear flow.Biophys J. 2012 Aug 22;103(4):629-39. doi: 10.1016/j.bpj.2012.07.009. Biophys J. 2012. PMID: 22947924 Free PMC article.
-
A Bundle of Mechanisms: Inner-Ear Hair-Cell Mechanotransduction.Trends Neurosci. 2019 Mar;42(3):221-236. doi: 10.1016/j.tins.2018.12.006. Epub 2019 Jan 17. Trends Neurosci. 2019. PMID: 30661717 Free PMC article. Review.
-
Excess area dependent scaling behavior of nano-sized membrane tethers.Phys Biol. 2018 Jan 11;15(2):026002. doi: 10.1088/1478-3975/aa9905. Phys Biol. 2018. PMID: 29116056 Free PMC article.
References
-
- Ethier CR, Simmonds CA. Introductory Biomechanics. From Cells to Organisms. Cambridge: Cambridge University Press; 2007.
Publication types
MeSH terms
Grants and funding
LinkOut - more resources
Full Text Sources
Miscellaneous