Comparative Study
. 2009 Dec 8;1(5):e00022.
doi: 10.1042/AN20090040.

Dynamic imaging of cannabinoid receptor 1 vesicular trafficking in cultured astrocytes

Affiliations
Comparative Study

Dynamic imaging of cannabinoid receptor 1 vesicular trafficking in cultured astrocytes

Kyle D Osborne et al. ASN Neuro. .

Abstract

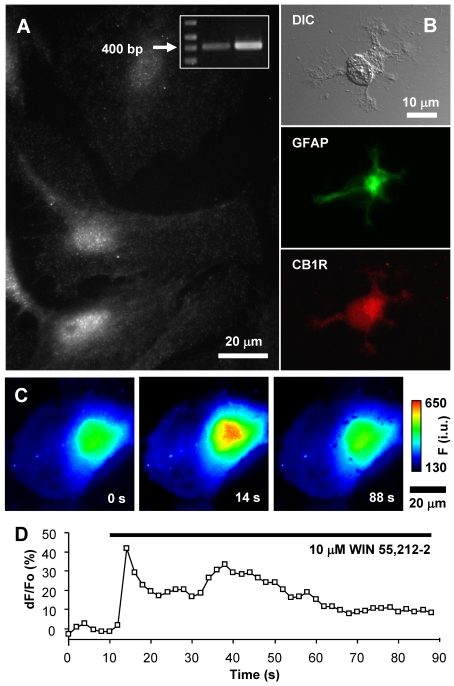
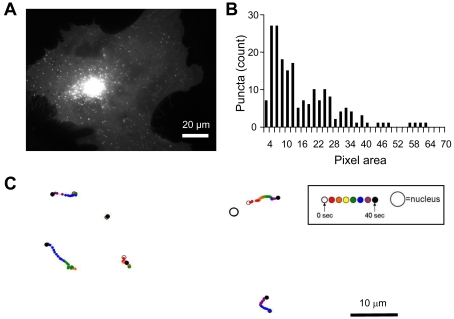
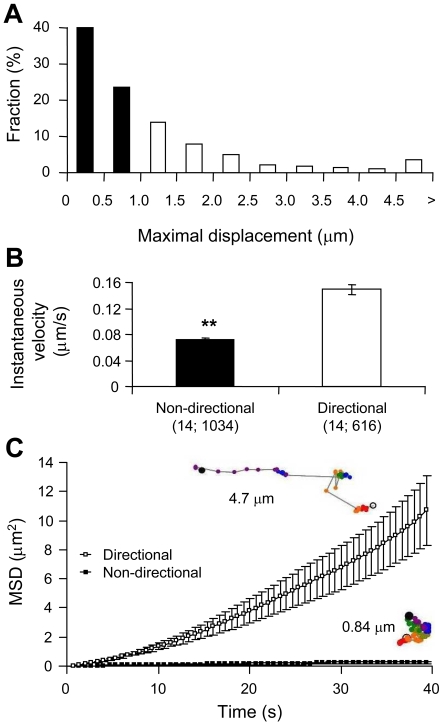
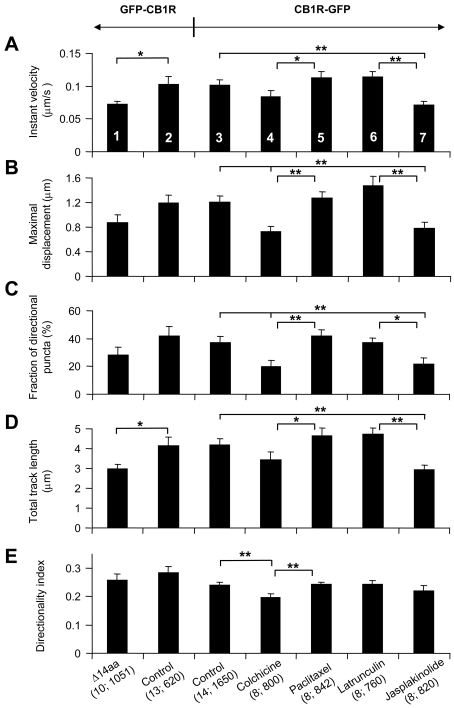
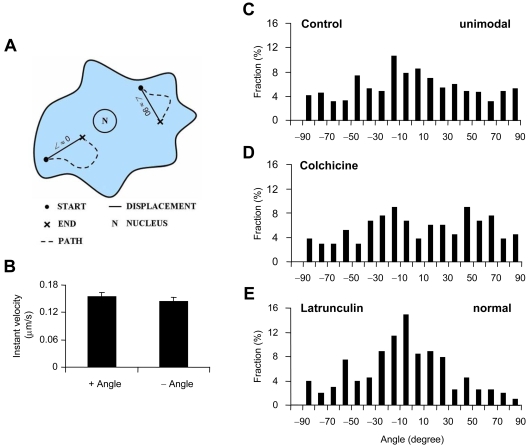
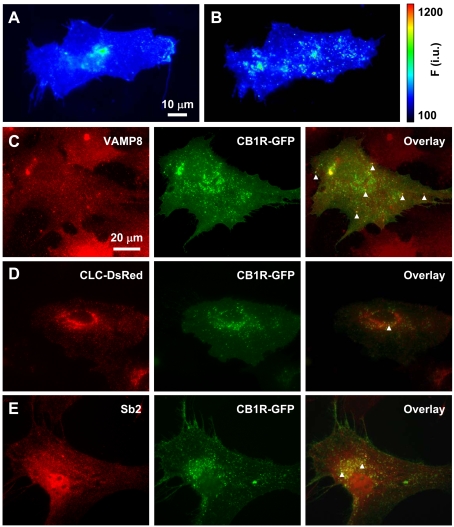
Astrocytes possess GPCRs (G-protein-coupled receptors) for neuroactive substances and can respond via these receptors to signals originating from neurons as well as astrocytes. Like many transmembrane proteins, GPCRs exist in a dynamic equilibrium between receptors expressed at the plasma membrane and those present within intracellular trafficking compartments. The characteristics of GPCR trafficking within astrocytes have not been investigated. We therefore monitored the trafficking of recombinant fluorescent protein chimeras of the CB1R (cannabinoid receptor 1) that is thought to be expressed natively in astrocytes. CB1R chimeras displayed a marked punctate intracellular localization when expressed in cultured rat visual cortex astrocytes, an expression pattern reminiscent of native CB1R expression in these cells. Based upon trafficking characteristics, we found the existence of two populations of vesicular CB1R puncta: (i) relatively immobile puncta with movement characteristic of diffusion and (ii) mobile puncta with movement characteristic of active transport along cytoskeletal elements. The predominant direction of active transport is oriented radially to/from the nuclear region, which can be abolished by disruption of the microtubule cytoskeleton. CB1R puncta are localized within intracellular acidic organelles, mainly co-localizing with endocytic compartments. Constitutive trafficking of CB1R to and from the plasma membrane is an energetically costly endeavour whose function is at present unclear in astrocytes. However, given that intracellular CB1Rs can engage cell signalling pathways, it is likely that this process plays an important regulatory role.


Figures

Figure 1
Figure 1. Expression of CB1R in visual cortex astrocytes
(A) Localization of CB1R in cultured rat visual cortex astrocytes was identified by indirect immunocytochemistry using an antibody against CB1R. Astrocytes display puncate staining throughout the entire cell body with some accumulation in the perinuclear region. RT–PCR identified the presence of CB1R mRNA in cultured astrocytes (inset). The arrow indicates the 400 bp marker. RT–PCR primers were designed to amplify a 412 bp fragment of the full-length CB1R transcript (middle lane, astrocytes; right-hand lane, whole brain). (B) Indirect immunocytochemistry using antibodies against GFAP and CB1R on acutely isolated astrocytes from visual cortex of P1 rats. Acutely isolated astrocytes that were identified by the presence of the specific marker GFAP (green, FITC) show typical stellate morphology (DIC) and CB1R (red, TRITC) stain reminiscent of that seen in cultured astrocytes. (C) Stimulation of an astrocyte with the CB1R agonist WIN55,212-2 (10 μM) causes an increase in the internal Ca2+ elevations. The pseudocolour scale is a linear representation of the fluorescence intensities ranging from 130 to 650 intensity units (i.u.). Times (in s) indicated on images correspond to the time on the x-axis of the graph displaying a time-lapse of fluo-3 fluorescence, reporting on internal Ca2+ levels. (D) Changes in fluo-3 fluorescence are shown as dF/Fo (%) after background subtraction. The horizontal bar in the graph indicates the application of WIN55,212-2.
Figure 2
Figure 2. Expression and trafficking of CB1R–GFP in astrocytes
(A) Astrocyte expressing full-length CB1R appended by GFP at its C-terminus (CB1R–GFP). The fluorescence pattern is similar to that of native CB1R with puncta present throughout entire cell, with some accumulation within the perinuclear region of the cell. (B) Distribution of CB1R–GFP puncta sizes within the size range selected for trafficking analysis for a single cell. For measurements of CB1R–GFP trafficking, 200 puncta ranging from 4 to 70 pixels (one pixel is equal to 106 nm×106 nm) in area were selected based on pixel intensity. Most of the puncta tracked fall within the 4–20 pixel area, whereas the incidence of puncta greater than 50 pixels in area was minor. (C) Example paths of tracked CB1R–GFP puncta coded in time by colour. The relative position of the travelled path of each punctum is indicated by the position of the nucleus (not drawn to scale). Both long-distance and short-range tracks can be observed. The time-lapse sequence of the intracellular CB1R–GFP trafficking in astrocyte in (A) is shown in Movie 1.
Figure 3
Figure 3. Mobility of CB1R–GFP puncta in astrocytes
(A) CB1R–GFP puncta were tracked during a 60 frame time-lapse series (40 s; Movie 1) and categorized by their maximal displacement, with non-directional puncta having maximal displacement less than 1 μm (solid bars) and directional greater than 1 μm (open bars). The histogram shows the relative frequency of maximal displacement values, expressed as a percentage for all puncta (n = 1650) within the cell analysed (n = 14). (B) Non-directional CB1R–GFP puncta (solid bar) display a significantly slower instantaneous velocity compared with the directional group (open bar) (Student's t test, **P<0.01). Bars represent mean instantaneous velocity±S.E.M. Values in parentheses indicate the number of cells; total number of puncta. (C) Graph showing the average MSD±S.E.M. as a function of time for all tracked CB1R–GFP puncta within the non-directional (▪) and directional (□) categories. Examples of single puncta mobility tracks for each category are shown next to the graph traces and are colour-coded for time as described in Figure 2(C); the total track length is 4.7 μm and 0.84 μm for directional and non-directional puncta respectively.
Figure 4
Figure 4. Distal C-terminal truncation of CB1R affects intracellular trafficking of this receptor, which utilizes microtubules and actin filaments for its traffic
(AE) Trafficking dynamics for cells expressing N-terminally tagged GFP–CB1R (column 2) display similar characteristics (no statistical difference) as C-terminally tagged CB1R–GFP (column 3). Truncation of GFP–CB1R at its C-terminal 14 amino acids (Δ14aa) reduces the instantaneous (Instant) velocity (A) and total track length (D) when compared with the control cells expressing the full-length GFP–CB1R (compare columns 1 and 2; Student's t test, *P<0.05). (A) Instantaneous velocity analysis of C-terminally tagged CB1R–GFP shows a decrease from control (column 3) when cells are treated with jasplakinolide (column 7). (B) Average maximal displacement was reduced significantly compared with control when cells were treated with colchicine and jasplakinolide (compare columns 3, 4 and 7). (C) The fraction of directional puncta was reduced when cells were treated with colchicine and jasplakinolide (compare columns 3, 4 and 7). (D) The average total length of tracks travelled by puncta was shorter for jasplakinolide-treated cells (compare columns 3 and 7). (E) The directionality index was reduced compared with control when cells were treated with colchicine (compare columns 3 and 4). Treatments with opposing actions on microtubules, disruption by colchicine and stabilization by paclitaxel, show a significant difference in all measured parameters (compare columns 4 and 5). Similarly, treatments with opposing actions on actin meshwork, disruption by latrunculin B and stabilization by jasplakinolide, show a significant difference in all measured parameters (AD; compare columns 6 and 7), with the exception of the directionality index (E). The effect of pharmacological agents affecting cytoskeletal elements on C-terminally labelled CB1R–GFP trafficking was statistically tested using one-way ANOVA followed by a post-hoc Fisher's LSD test; *P<0.05 and **P<0.01 respectively. All bars, numbered by column to aid comparison, represent means±S.E.M. of individual cell averages for tracked puncta. Values in parentheses indicate number of cells; total number of puncta.
Figure 5
Figure 5. Preferential radial trafficking of directional CB1R–GFP
(A) Diagram shows the convention used for defining displacement angles (∠), ranging from −90° to 90°, from the path (dotted line) of the individual directional CB1R–GFP puncta. Angle values approach 0° as trajectories become more radial, directly towards or away from the nucleus of the cell (N), whereas more tangential trajectories associate with angle values approaching ±90°. (B) The instantaneous (Instant) velocity of directional CB1R–GFP puncta trafficking away (+ Angle) from the nucleus was no different from that observed for puncta travelling towards (− Angle) the nucleus (n = 13 cells). (CE) Charts show frequency histograms of displacement angles for control (C), colchicine-treated (D) and latrunculin B-treated (E) cells . (C) Histogram of displacement angles for control cells shows unimodal distribution (n = 557 puncta; dip-test, P<0.05) with the mode near 0° identifying the preferential mode of directional CB1R–GFP trafficking to be radial, towards and away from the nucleus, whereas a substantial amount of trafficking occurs tangential to the nucleus. (D) When cells were treated with colchicine, the preference for radial trafficking is abolished (n = 133 puncta), with display of an apparent bimodal distribution. (E) Near 0° angles predominate with displacement angles showing normal (n = 202 puncta; D’Agostino Test, P>0.05), albeit not unimodal, distribution, when astrocytes were treated with latrunculin B.
Figure 6
Figure 6. Intracellular CB1R localization in astrocytes
(A and B) The presence of SEP–CB1R in low-pH intracellular structures. (A) Astrocyte expressing SEP–CB1R at rest. (B) After incubation with bafilomycin A1 to block V-ATPase, SEP–CB1R fluorescence intensity increases displaying more prominently punctate fluorescence indicating that a population of SEP–CB1R exists within acidic compartments. The pseudocolour scale is a linear representation of the fluorescence intensities ranging from 100 to 1200 intensity units (i.u.). (CE) Intracellular CB1R–GFP localizes in endosomes. (C) CB1R–GFP (green, middle panel)-expressing astrocytes immunolabelled for endobrevin (VAMP8) (red, left-hand panel), an endosomal marker. Arrowheads mark some instances of co-localization of CB1R–GFP and endogenous VAMP8 (overlay, right-hand panel). (D) Co-expressed CLC–DsRed (red, left-hand panel), labelling early endocytic structures, and CB1R–GFP (green, middle panel) show very little co-localization (overlay, right-hand panel; arrowhead). (E) CB1R–GFP (green, middle panel)-expressing astrocytes immunolabelled for the exocytotic vesicle marker synaptobrevin 2 (Sb2) (red, left-hand panel). Subcellular localization of CB1R–GFP and Sb2 immunoreactivity show some overlap (overlay, right-hand panel; arrowheads) within the perinuclear region of the cell, whereas co-localization was not apparent at the periphery of the cell.

References

    1. Aoki C, Joh TH, Pickel VM. Ultrastructural localization of β-adrenergic receptor-like immunoreactivity in the cortex and neostriatum of rat brain. Brain Res. 1987;437:264–282. - PubMed
    1. Coutts AA, Anavi-Goffer S, Ross RA, MacEwan DJ, Mackie K, Pertwee RG, Irving AJ. Agonist-induced internalization and trafficking of cannabinoid CB1 receptors in hippocampal neurons. J Neurosci. 2001;21:2425–2433. - PMC - PubMed
    1. Crippa D, Schenk U, Francolini M, Rosa P, Verderio C, Zonta M, Pozzan T, Matteoli M, Carmignoto G. Synaptobrevin 2-expressing vesicles in rat astrocytes: insights into molecular characterization, dynamics and exocytosis. J Physiol. 2006;570:567–582. - PMC - PubMed
    1. Evans LL, Bridgman PC. Particles move along actin filament bundles in nerve growth cones. Proc Natl Acad Sci USA. 1995;92:10954–10958. - PMC - PubMed
    1. Giau R, Carrette J, Bockaert J, Homburger V. Constitutive secretion of protease nexin-1 by glial cells and its regulation by G-protein-coupled receptors. J Neurosci. 2005;25:8995–9004. - PMC - PubMed

Publication types

Substances

LinkOut - more resources