. 2009 Nov 11:7:94.
doi: 10.1186/1479-5876-7-94.

Optical imaging of the peri-tumoral inflammatory response in breast cancer

Affiliations

Optical imaging of the peri-tumoral inflammatory response in breast cancer

Akhilesh K Sista et al. J Transl Med. .

Abstract

Purpose: Peri-tumoral inflammation is a common tumor response that plays a central role in tumor invasion and metastasis, and inflammatory cell recruitment is essential to this process. The purpose of this study was to determine whether injected fluorescently-labeled monocytes accumulate within murine breast tumors and are visible with optical imaging.

Materials and methods: Murine monocytes were labeled with the fluorescent dye DiD and subsequently injected intravenously into 6 transgenic MMTV-PymT tumor-bearing mice and 6 FVB/n control mice without tumors. Optical imaging (OI) was performed before and after cell injection. Ratios of post-injection to pre-injection fluorescent signal intensity of the tumors (MMTV-PymT mice) and mammary tissue (FVB/n controls) were calculated and statistically compared.

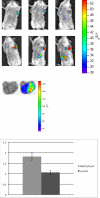
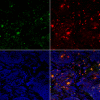
Results: MMTV-PymT breast tumors had an average post/pre signal intensity ratio of 1.8+/- 0.2 (range 1.1-2.7). Control mammary tissue had an average post/pre signal intensity ratio of 1.1 +/- 0.1 (range, 0.4 to 1.4). The p-value for the difference between the ratios was less than 0.05. Confocal fluorescence microscopy confirmed the presence of DiD-labeled cells within the breast tumors.

Conclusion: Murine monocytes accumulate at the site of breast cancer development in this transgenic model, providing evidence that peri-tumoral inflammatory cell recruitment can be evaluated non-invasively using optical imaging.


Figures
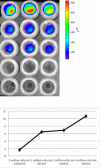
Figure 1
Figure 1
(a) Optical imaging of DiD-labeled cells immediately after labeling. First 3 rows: triplicately labeled cells. (Top row: 4 million/cells mL; Second row: 2 million cells/mL; Third row: 1 million cells/mL). Fourth row: unlabeled cells (2 million cells/mL). Fifth row: DMEM alone. (b) Ratio of fluorescence of cells to media (Y-Axis) for each sample of cells (X-Axis). The ratio of labeled cells to media was significantly higher at all concentrations than the ratio of unlabeled cells to media (p < 0.01). Error bars represent standard error of the mean.
Figure 2
Figure 2
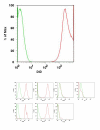
(a) Flow cytometry for DiD-labeled 416B murine monocytes. Left peak (green): unlabeled cells, right peak (red): DiD-labeled cells. (b) Flow cytometry characterization of 416B murine monocyte cell line. Top row: 416B cell line, bottom row: peripheral blood monocytes from FVB/n control mice. For all images, the green peak represents unlabeled cells, and the red peak represents labeled cells.
Figure 3
Figure 3
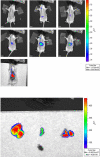
(a) In vivo optical imaging of a control FVB/n mouse after intravenous injection of DiD-labeled monocytes. Top row, left to right: pre-injection, 1 hour, and 2 hours post-injection. Middle row, left to right: 6 hours, 12, and 24 hours post injection. Bottom image: post-mortem dissection. (b) Removed organs 24 hours post injection. Left to right: Liver, spleen, lungs, heart. Images are representative of the FVB/n control mice injected with DiD-labeled monocytes.
Figure 4
Figure 4
(a) In vivo optical imaging of a MMTV-PymT mouse after intravenous injection of DiD-labeled monocytes. Top row, left to right: pre-injection, 1 hour, 2 hours post-injection. Bottom row, left to right: 6 hours, 12 hours, 24 hours post-injection. (b) Optical imaging of explanted left axillary tumor from the same mouse. Left to right: photograph only, fluorescence image. Images are representative of the MMTV-PymT mice injected with DiD-labeled monocytes. (c) Quantitative analysis of fluorescence from breast tumors following injection of DiD-labeled monocytes. The left bar represents the average SI post/pre fluorescence ratio within breast tumors from MMTV-PymT mice, while the right bar represents the average SI post/pre fluorescence ratio within mammary tissue from FVB/n controls. Y-axis: average SI post/pre fluorescence ratio. Error bars represent the standard error of the mean. The difference between the two ratios was statistically significant, with a p-value less than 0.05.
Figure 5
Figure 5
Immunofluorescence/confocal microscopy. Top row, left to right: CD45, DiD. Bottom row: DAPI, merged image. Confocal images are representative of the MMTV-PymT control mice injected with DiD-labeled monocytes. Images are at 10× magnification.

Similar articles

Cited by

References

    1. Oluwole SF, Ali AO, Shafaee Z, DePaz HA. Breast cancer in women with HIV/AIDS: report of five cases with a review of the literature. J Surg Oncol. 2005;89:23–27. doi: 10.1002/jso.20171. - DOI - PubMed
    1. Stewart T, Tsai SC, Grayson H, Henderson R, Opelz G. Incidence of de-novo breast cancer in women chronically immunosuppressed after organ transplantation. Lancet. 1995;346:796–798. doi: 10.1016/S0140-6736(95)91618-0. - DOI - PubMed
    1. DeNardo DG, Coussens LM. Inflammation and breast cancer. Balancing immune response: crosstalk between adaptive and innate immune cells during breast cancer progression. Breast Cancer Res. 2007;9:212. doi: 10.1186/bcr1746. - DOI - PMC - PubMed
    1. Balkwill F, Charles KA, Mantovani A. Smoldering and polarized inflammation in the initiation and promotion of malignant disease. Cancer Cell. 2005;7:211–217. doi: 10.1016/j.ccr.2005.02.013. - DOI - PubMed
    1. Coussens LM, Werb Z. Inflammation and cancer. Nature. 2002;420:860–867. doi: 10.1038/nature01322. - DOI - PMC - PubMed

Publication types

Substances