Review
. 2010 Oct;115(1):45-58.
doi: 10.1016/j.bandl.2009.09.005. Epub 2009 Nov 11.

Sleep, off-line processing, and vocal learning

Affiliations
Review

Sleep, off-line processing, and vocal learning

Daniel Margoliash et al. Brain Lang. 2010 Oct.

Abstract

The study of song learning and the neural song system has provided an important comparative model system for the study of speech and language acquisition. We describe some recent advances in the bird song system, focusing on the role of off-line processing including sleep in processing sensory information and in guiding developmental song learning. These observations motivate a new model of the organization and role of the sensory memories in vocal learning.


Figures

Figure 1
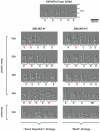
Figure 1. Learning the same song using different developmental strategies
Song development is shown for two juvenile zebra finch siblings (sibling #1 and sibling #2) from the same clutch. Both birds mastered the same 1-second long song motif they heard from their father. The highly stereotyped song motif of the father (labeled “Father (Tutor) Song”) is shown at the top and consists of five different syllables, identified by letters A through E. Sibling #1 utilizes a “serial repetition” strategy where he transitions from subsong to a song that consists of repetitions of the same syllable (shown in red). He then modifies each syllable so that they eventually match the different syllables produced in the father’s song. Sibling #2 on the other hand, transitions from subsong by producing a global imitation of the father’s song with each element already in the right place in the motif but produced in a very noisy and imprecise way. With time he refines the acoustic properties of each element without any major modifications of the sequence. The vertical axis corresponds to frequency, in kilohertz, and the horizontal axis corresponds to time, in msec. (Modified from Figure 3 in Liu and Nottebohm (2004) PNAS 101: 18177 - 18182)
Figure 2
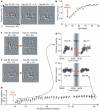
Figure 2. Developmental manifestation of a circadian singing pattern following tutor exposure
(a, b) Song acoustic structure increases incrementally following tutor song exposure. Acoustic structure is quantified using a measure known as Wiener entropy variance (EV) where high values represent more structure and low values less structure. Changes in EV throughout development are shown in (b). Examples of the same syllable with their corresponding EV values are shown in (a). (c - g) Using the same measure, it is possible to quantify the changes in syllable acoustic structure that occur within a given day. In juvenile birds, there is a dramatic drop in EV that is observed between syllables produced in the evening and those produced the following morning (c, d). This drop in acoustic structure is not observed in adult birds that sing a stable song (e, f). In figures d and f, each point represents the EV value measured for each rendition of this sample syllable. In addition to the marked drop in EV that occurs from one day to the next, there is also a steady increase in EV throughout the day. EV values measured at the end of the day show a steady increase throughout development (especially between days 45 and 60) (g). The degree of circadian change in EV is directly correlated with the quality of the vocal imitation (not shown). (Modified from Figure 3 in Deregnaucourt et al. (2005) Nature 433: 710-716.)
Figure 3
Figure 3. Schematic representation of the avian song system and its auditory inputs
The avian song system can be divided into three main divisions. The descending motor pathway (shown in black) includes telencephalic areas HVC and RA as well as brainstem nuclei that drive the muscles of the syrinx (nXIIts) or the respiratory system (RAm and PAm). These later two structures form part of a vocal respiratory network that also includes DM. The second division, sometimes called the ventral motor pathway, consists of projections from the diencephalon and brainstem back to HVC (shown in green). The third major division of the song system consists of the anterior pathway (shown in light red), which is made up of Area X, DLM, and LMAN. The song system receives processed auditory information from an ascending auditory pathway (shown in blue). Areas where BOS-selective responses have been recorded are outlined in red. Anatomical names: DLM, medial part of the dorsolateral thalamic nucleus; LMAN, lateral magnocellular nucleus of the anterior nidopallium; Field L is the primary auditory forebrain structure in birds; Area X, Area X of the medial striatum; NIf, nucleus interfacialis of the nidopallium; RAm, nucleus retroambigualis; PAm, nucleus paraambigualus; DM, dorsomedial nucleus of the intercollicular complex; CMM, caudal medial mesopallium; CLM, caudal lateral mesopallium; Field L, auditory forebrain areas consisting of Field L1, L2, L2a, L2b and L3; Ov/Ovm, nucleus ovoidalis; MLd, dorsal lateral nucleus of the mesencephalon; NCM, caudal medial nidopallium; LLV, ventral nucleus of the lateral lemniscus.
Figure 4
Figure 4. Comparing ongoing neuronal activity during sleep and during singing in an adult zebra finch
a) Neuronal trace of an RA neuron emitting 10 distinct bursts of 2 - 7 spikes per burst (“Singing”). The bursts are precisely timed to when the bird sang a song whose motif consisted of a sequence of five syllables (see spectrograph, frequency vs. time representation; top). For each song bout, the sequence of syllables and the structure of each spike burst (timing of spikes and numbers of spikes) was highly reliable. b) The recording was maintained for several hours until the bird was deeply asleep. During sleep, occasionally the neuron emitted one or more bursts. Individual bursts, and sequences of bursts, had far greater variability than during singing, but nevertheless sleep bursts matched bursts emitted during singing. In the example shown (“Sleep, ongoing”), the neuron spontaneously emits nine distinct bursts of 1 - 4 spikes per burst. The structure and timing of many of the bursts are remarkably similar but distinct from the equivalent bursts during singing. (Modified from Dave & Margoliash 2000)
Figure 5
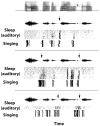
Figure 5. Comparing auditory responses during sleep and spike bursting during singing in an adult zebra finch
The spectrograph (top) of a representative motif of the bird’s song (same bird as in Figure 4). This song was played back while the bird slept during recordings from three distinct RA neurons. The responses of the neurons are shown in the three panels below the spectrograph, with each panel composed of three displays. Within each panel, the top display is an oscillograph of the song, and the bottom two displays are rasters of spikes. Within the rasters, one horizontal trace represents one repetition of the song, with the tick marks at the locations when the neuron spiked. The middle rasters (“Sleep, auditory”) show the neuron’s response to song playback during sleep; the bottom rasters (“Singing”) show the singing-related activity recorded during daytime singing. Note that there is more and better structured activity in response to song playback towards the ends of the motif, and that some spike bursts during song playback precede the syllables (arrows). (Modified from Dave 2001)
Figure 6
Figure 6. Changes in RA neuronal activity during sleep and the onset of juvenile song learning
a) Interspike interval histogram (ISI) distributions for all 19 RA neurons recorded on three nights prior to the onset of tutor song exposure (black curve) and for all 59 cells on 12 following nights (red curve). Cells recorded in the period when the bird is learning to sing have much greater high frequency bursting. b) Data from all 13 birds recorded on nights prior to (black points) and following (red points) the onset of tutor song exposure. Bursting activity is quantified as the area under the ISIs from 1 - 40 ms, relative to the baseline area defined as the average of the four nights preceding the first post-tutoring night. Each point is the average (± s.e.m.) across all birds contributing to that night; the number above each point is the number of birds contributing to that point. For each bird the average was calculated across all cells recorded that night. Note that the amount of spike bursting increases on the first night following tutor song exposure and reaches a plateau by the second night. c) ISI distributions, one per bird averaged across all cells for that bird, from birds that learned one particular tutor song (“Song 1”). The magnitude of the curves varies but the shape (location and width of peak) is generally conserved. d) Comparison of means (± s.e.m.) of ISI distributions across three groups of birds, that learned either “Song 1” (red dashed curve), “Song 2” (green curve), or “Song 3” (blue curve). The ISI distributions vary depending on which tutor song the birds were exposed to. Eliminating the two “Song 1” birds with the greatest high-frequency bursting (see c) (red solid curve) preserves differences between “Song 1” and the other two tutor song types. (Modified from Shank & Margoliash 2009)

Similar articles

Cited by

References

    1. Akutagawa E, Konishi M. Connections of thalamic modulatory centers to the vocal control system of the zebra finch. Proceedings of the National Academy of Sciences of the United States of America. 2005;102(39):14086–14091. Scopus. - PMC - PubMed
    1. Appeltants D, Absil P, Balthazart J, Ball GF. Identification of the origin of catecholaminergic inputs to HVc in canaries by retrograde tract tracing combined with tyrosine hydroxylase immunocytochemistry. Journal of Chemical Neuroanatomy. 2000;18(3):117–133. Scopus. - PubMed
    1. Aronov D, Andalman AS, Fee MS. A specialized forebrain circuit for vocal babbling in the juvenile songbird. Science. 2008;320(5876):630–634. Scopus. - PubMed
    1. Ashmore RC, Renk JA, Schmidt MF. Bottom-up activation of the vocal motor forebrain by the respiratory brainstem. Journal of Neuroscience. 2008;28(10):2613–2623. Scopus. - PMC - PubMed
    1. Ashmore RC, Wild JM, Schmidt MF. Brainstem and forebrain contributions to the generation of learned motor behaviors for song. Journal of Neuroscience. 2005;25(37):8543–8554. - PMC - PubMed