

Noninvasive assessment of tumor microenvironment using dynamic contrast-enhanced magnetic resonance imaging and 18F-fluoromisonidazole positron emission tomography imaging in neck nodal metastases
- PMID: 19906496
- PMCID: PMC2888682
- DOI: 10.1016/j.ijrobp.2009.07.009
Noninvasive assessment of tumor microenvironment using dynamic contrast-enhanced magnetic resonance imaging and 18F-fluoromisonidazole positron emission tomography imaging in neck nodal metastases
Abstract
Purpose: To assess noninvasively the tumor microenvironment of neck nodal metastases in patients with head-and-neck cancer by investigating the relationship between tumor perfusion measured using dynamic contrast-enhanced magnetic resonance imaging (DCE-MRI) and hypoxia measured by (18)F-fluoromisonidazole ((18)F-FMISO) positron emission tomography (PET).
Methods and materials: Thirteen newly diagnosed head-and-neck cancer patients with metastatic neck nodes underwent DCE-MRI and (18)F-FMISO PET imaging before chemotherapy and radiotherapy. The matched regions of interests from both modalities were analyzed. To examine the correlations between DCE-MRI parameters and standard uptake value (SUV) measurements from (18)F-FMISO PET, the nonparametric Spearman correlation coefficient was calculated. Furthermore, DCE-MRI parameters were compared between nodes with (18)F-FMISO uptake and nodes with no (18)F-FMISO uptake using Mann-Whitney U tests.
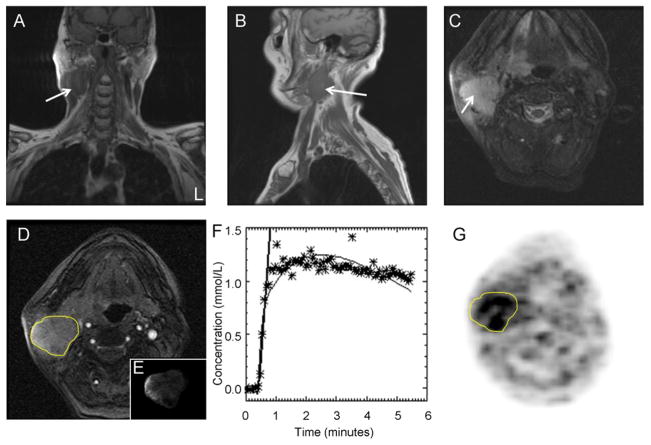
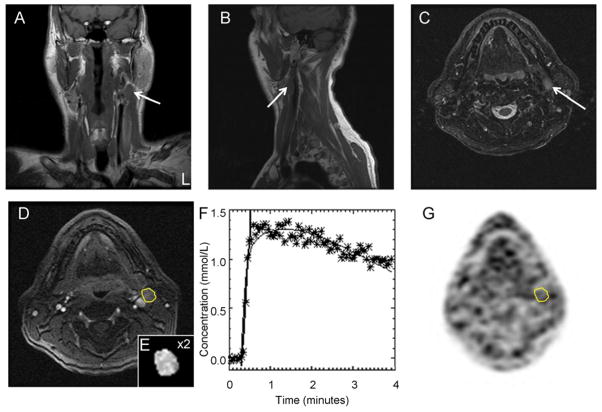
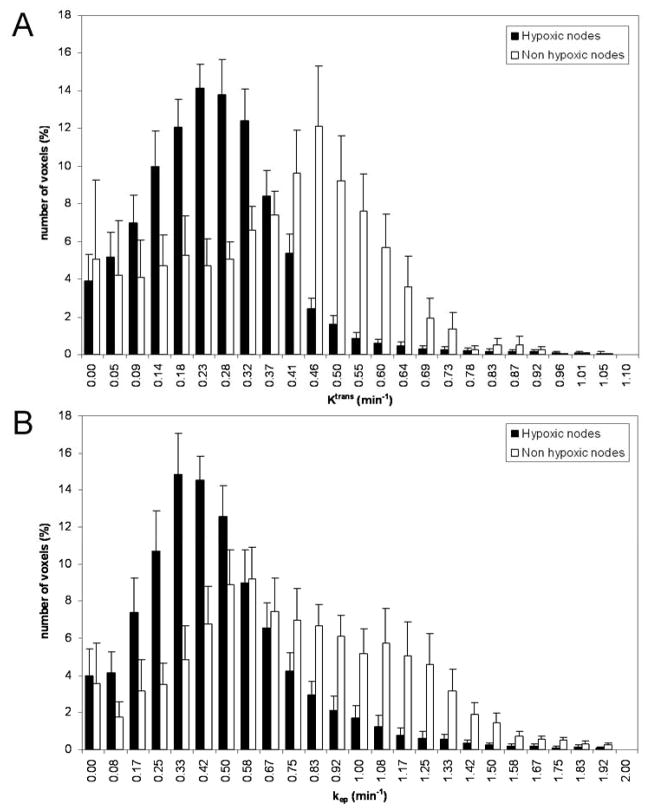
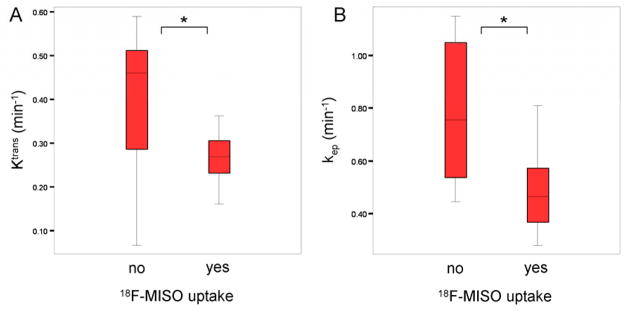
Results: For the 13 patients, a total of 18 nodes were analyzed. The nodal size strongly correlated with the (18)F-FMISO SUV (rho = 0.74, p < 0.001). There was a strong negative correlation between the median k(ep) (redistribution rate constant) value (rho = -0.58, p = 0.042) and the (18)F-FMISO SUV. Hypoxic nodes (moderate to severe (18)F-FMISO uptake) had significantly lower median K(trans) (volume transfer constant) (p = 0.049) and median k(ep) (p = 0.027) values than did nonhypoxic nodes (no (18)F-FMISO uptake).
Conclusion: This initial evaluation of the preliminary results support the hypothesis that in metastatic neck lymph nodes, hypoxic nodes are poorly perfused (i.e., have significantly lower K(trans) and k(ep) values) compared with nonhypoxic nodes.
Copyright 2010 Elsevier Inc. All rights reserved.
Figures
References
-
- Gillies RJ, Raghunand N, Karczmar GS, et al. MRI of the tumor microenvironment. J Magn Reson Imaging. 2002;16:430–450. - PubMed
-
- Hylton N. Dynamic contrast-enhanced magnetic resonance imaging as an imaging biomarker. J Clin Oncol. 2006;24:3293–3298. - PubMed
-
- Hoffmann U, Brix G, Knopp MV, et al. Pharmacokinetic mapping of the breast: a new method for dynamic MR mammography. Magn Reson Med. 1995;33:506–514. - PubMed
-
- Port E, Knopp MV, Hoffmann U, et al. Multicompartment analysis of gadolinium chelate kinetics: blood-tissue exchange in mammary tumors as monitored by dynamic MR imaging. J Magn Reson Imaging. 1999;10:233–241. - PubMed
-
- Tofts PS, Brix G, Buckley DL, et al. Estimating kinetic parameters from dynamic contrast-enhanced T(1)-weighted MRI of a diffusable tracer: standardized quantities and symbols. J Magn Reson Imaging. 1999;10:223–232. - PubMed
Publication types
MeSH terms
Substances
Grants and funding
LinkOut - more resources
Full Text Sources
Medical
