

Telomeric DNA induces p53-dependent reactive oxygen species and protects against oxidative damage
- PMID: 19906512
- PMCID: PMC2844100
- DOI: 10.1016/j.jdermsci.2009.08.008
Telomeric DNA induces p53-dependent reactive oxygen species and protects against oxidative damage
Abstract
Background: Reactive oxygen species (ROS) are generated by cellular metabolism as well as by exogenous agents. While ROS can promote cellular senescence, they can also act as signaling molecules for processes that do not lead to senescence. Telomere homolog oligonucleotides (T-oligos) induce adaptive DNA damage responses including increased DNA repair capacity and these effects are mediated, at least in part, through p53.
Objective: Studies were undertaken to determine whether such p53-mediated protective responses include enhanced antioxidant defenses.
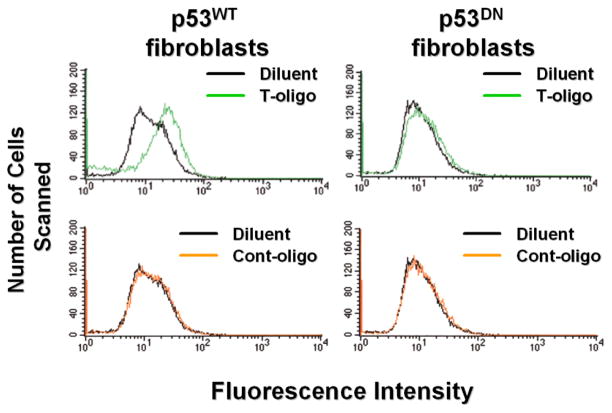
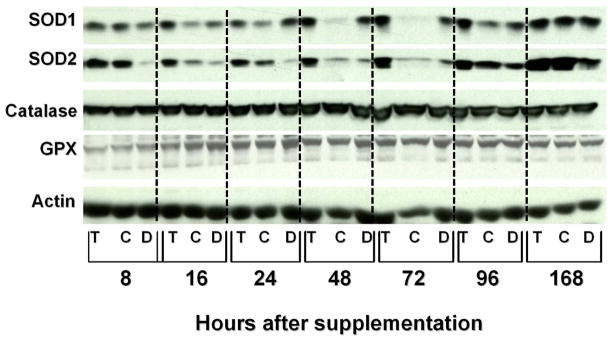
Methods: Normal human fibroblasts as well as R2F fibroblasts expressing wild type or dominant negative p53 were treated with an 11-base T-oligo, a complementary control oligo or diluents alone and then examined by western blot analysis, immunofluorescence microscopy and various biochemical assays.
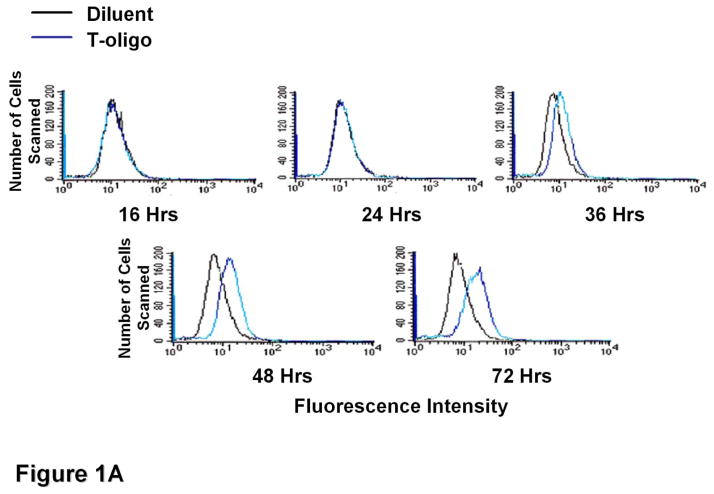
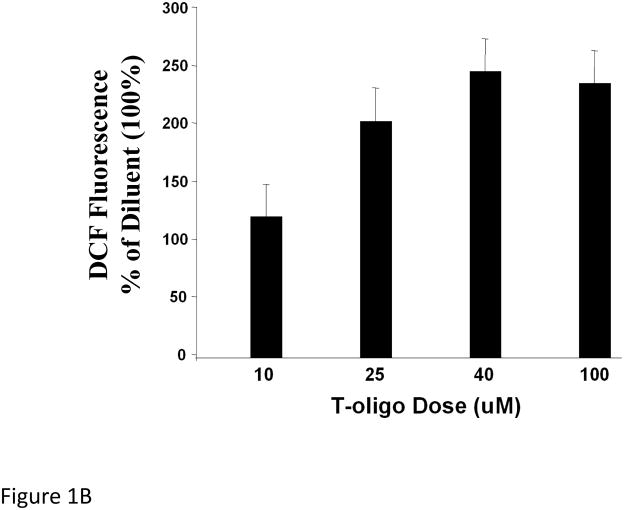
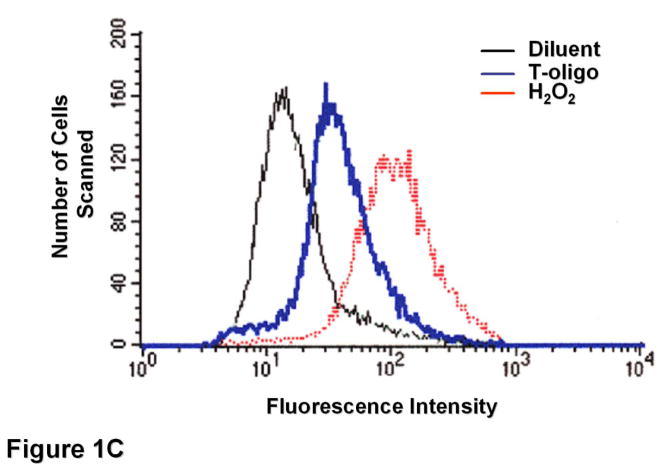
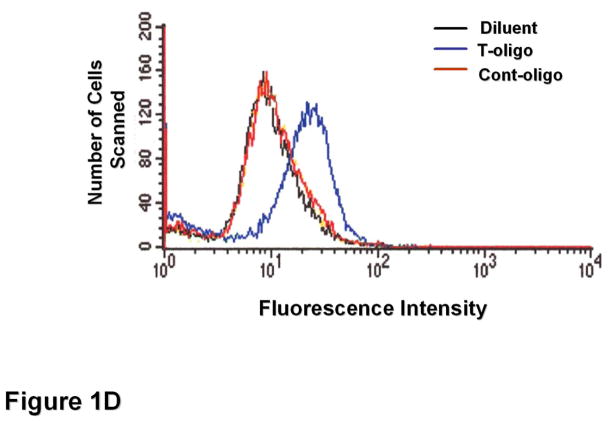
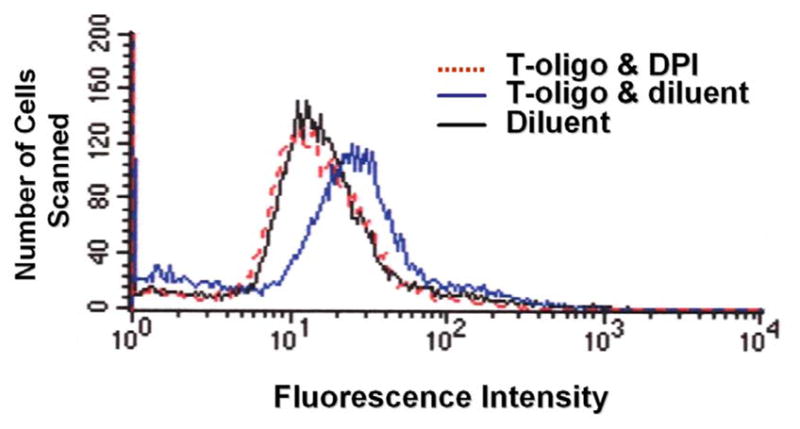
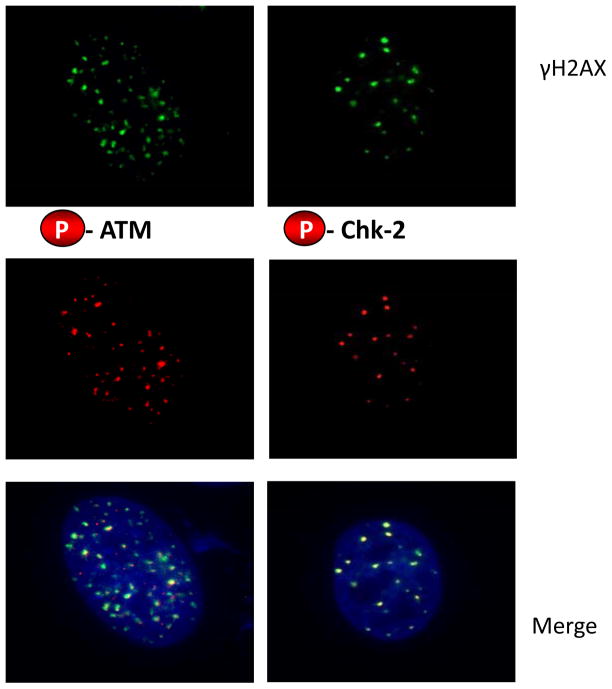
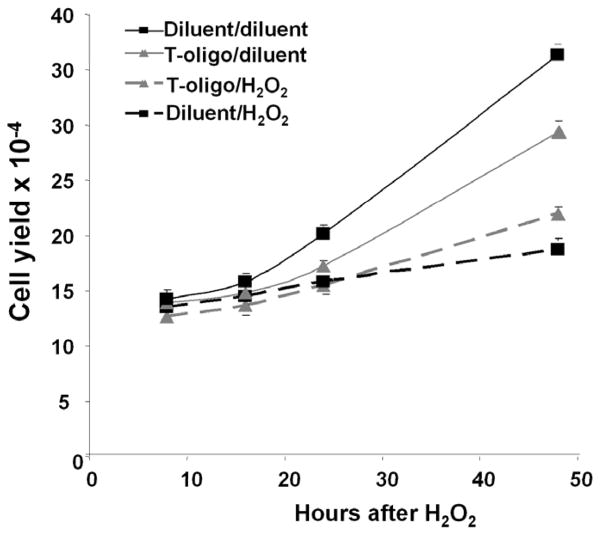
Results: We now report that T-oligo increases the level of the antioxidant enzymes superoxide dismutase 1 and 2 and protects cells from oxidative damage; and that telomere-based gammaH2AX (DNA damage) foci that form in response to T-oligos contain phosphorylated ATM and Chk2, proteins known to activate p53 and to mediate cell cycle arrest in response to oxidative stress. Further, T-oligo increases cellular ROS levels via a p53-dependent pathway, and these increases are abrogated by the NAD(P)H oxidase inhibitor diphenyliodonium chloride.
Conclusion: These results suggest the existence of innate telomere-based protective responses that act to reduce oxidative damage to cells. T-oligo treatment induces the same responses and offers a new model for studying intracellular ROS signaling and the relationships between DNA damage, ROS, oxidative stress, and cellular defense mechanisms.
Conflict of interest statement
Portions of the work reported in this article pertain to a patent application for which M.S. L-B, M.Y., M.S.E. and B.A.G. are co-inventors and, if awarded, will be assigned to the Trustees of Boston University (their employer) and then licensed to SemaCo, Inc., a for-profit company created to commercialize intellectual property arising out of their laboratory. M.Y., M.S.E. and B.A.G. all hold equity in SemaCo, and B.A.G. is SemaCo’s Chief Scientific Officer.
Figures
Similar articles
-
DNA damage signaling and p53-dependent senescence after prolonged beta-interferon stimulation.Mol Biol Cell. 2006 Apr;17(4):1583-92. doi: 10.1091/mbc.e05-09-0858. Epub 2006 Jan 25. Mol Biol Cell. 2006. PMID: 16436515 Free PMC article.
-
DNA processing is not required for ATM-mediated telomere damage response after TRF2 deletion.Nat Cell Biol. 2005 Jul;7(7):712-8. doi: 10.1038/ncb1275. Epub 2005 Jun 19. Nat Cell Biol. 2005. PMID: 15968270
-
ATR-Chk2 signaling in p53 activation and DNA damage response during cisplatin-induced apoptosis.J Biol Chem. 2008 Mar 7;283(10):6572-83. doi: 10.1074/jbc.M707568200. Epub 2007 Dec 27. J Biol Chem. 2008. PMID: 18162465
-
Constitutive histone H2AX phosphorylation and ATM activation, the reporters of DNA damage by endogenous oxidants.Cell Cycle. 2006 Sep;5(17):1940-5. doi: 10.4161/cc.5.17.3191. Epub 2006 Sep 1. Cell Cycle. 2006. PMID: 16940754 Free PMC article. Review.
-
Molecular mechanisms of oxidative stress in asthma.Mol Aspects Med. 2022 Jun;85:101026. doi: 10.1016/j.mam.2021.101026. Epub 2021 Oct 6. Mol Aspects Med. 2022. PMID: 34625291 Review.
Cited by
-
Non-small cell lung cancer is susceptible to induction of DNA damage responses and inhibition of angiogenesis by telomere overhang oligonucleotides.Cancer Lett. 2014 Feb 1;343(1):14-23. doi: 10.1016/j.canlet.2013.09.010. Epub 2013 Sep 14. Cancer Lett. 2014. PMID: 24041868 Free PMC article.
-
Telomere shortening and accelerated aging in COPD: findings from the BODE cohort.Respir Res. 2017 Apr 13;18(1):59. doi: 10.1186/s12931-017-0547-4. Respir Res. 2017. PMID: 28407775 Free PMC article.
-
Alternative strategy for Alzheimer's disease: stress response triggers.Int J Alzheimers Dis. 2012;2012:684283. doi: 10.1155/2012/684283. Epub 2012 May 10. Int J Alzheimers Dis. 2012. PMID: 22655213 Free PMC article.
-
5-Aminolevulinic Acid-Based Photodynamic Therapy Pretreatment Mitigates Ultraviolet A-Induced Oxidative Photodamage.Oxid Med Cell Longev. 2018 Nov 7;2018:9420745. doi: 10.1155/2018/9420745. eCollection 2018. Oxid Med Cell Longev. 2018. Retraction in: Oxid Med Cell Longev. 2020 Aug 29;2020:2769472. doi: 10.1155/2020/2769472. PMID: 30524664 Free PMC article. Retracted.
-
Characterization of cellular senescence mechanisms in human corneal endothelial cells.Aging Cell. 2012 Apr;11(2):234-40. doi: 10.1111/j.1474-9726.2011.00776.x. Epub 2011 Dec 29. Aging Cell. 2012. PMID: 22128747 Free PMC article.
References
-
- Moyzis RK, Buckingham JM, Cram LS, Dani M, Deaven LL, Jones MD, Meyne J, Ratliff RL, Wu JR. A highly conserved repetitive DNA sequence, (TTAGGG)n, present at the telomeres of human chromosomes. Proceedings of the National Academy of Sciences of the United States of America. 1988;85:6622–6626. - PMC - PubMed
-
- Shay JW, Wright WE. Telomeres are double-strand DNA breaks hidden from DNA damage responses. Molecular cell. 2004;14:420–421. - PubMed
-
- Takai H, Smogorzewska A, de Lange T. DNA damage foci at dysfunctional telomeres. Curr Biol. 2003;13:1549–1556. - PubMed
-
- Bodnar AG, Ouellette M, Frolkis M, Holt SE, Chiu CP, Morin GB, Harley CB, Shay JW, Lichtsteiner S, Wright WE. Extension of life-span by introduction of telomerase into normal human cells. Science (New York, NY) 1998;279:349–352. - PubMed
Publication types
MeSH terms
Substances
Grants and funding
LinkOut - more resources
Full Text Sources
Other Literature Sources
Research Materials
Miscellaneous
