. 2010 Jan;38(3):e13.
doi: 10.1093/nar/gkp1012. Epub 2009 Nov 11.

Sole-Search: an integrated analysis program for peak detection and functional annotation using ChIP-seq data

Affiliations

Sole-Search: an integrated analysis program for peak detection and functional annotation using ChIP-seq data

Kimberly R Blahnik et al. Nucleic Acids Res. 2010 Jan.

Abstract

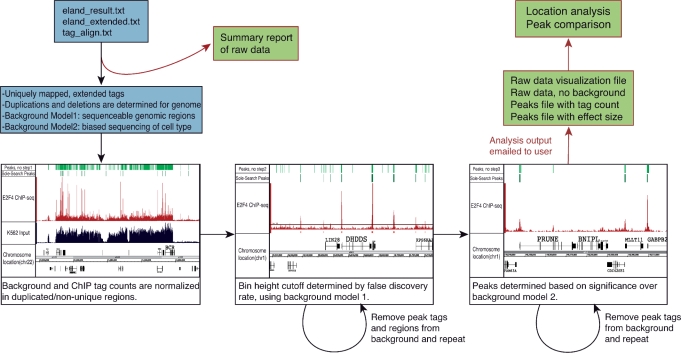
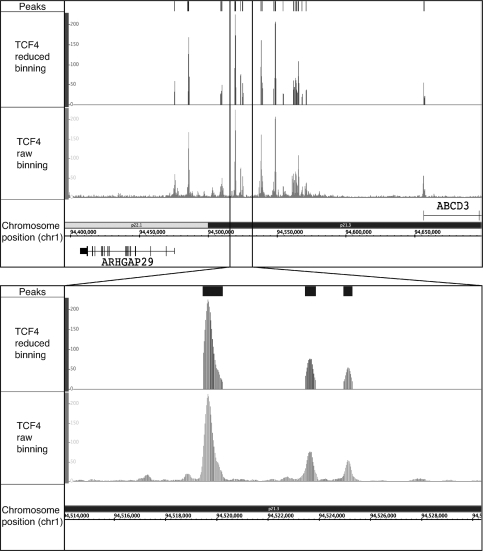
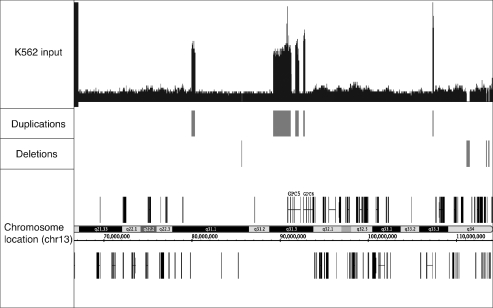
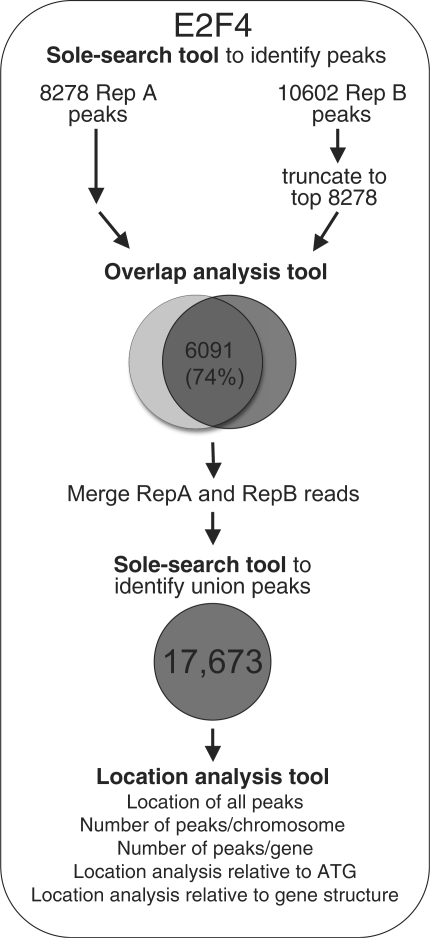
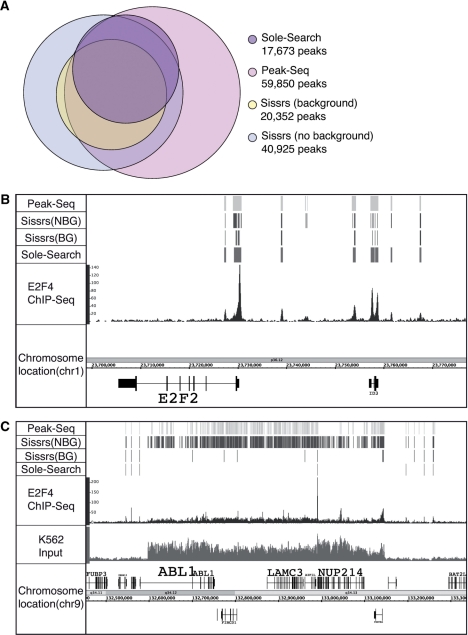
Next-generation sequencing is revolutionizing the identification of transcription factor binding sites throughout the human genome. However, the bioinformatics analysis of large datasets collected using chromatin immunoprecipitation and high-throughput sequencing is often a roadblock that impedes researchers in their attempts to gain biological insights from their experiments. We have developed integrated peak-calling and analysis software (Sole-Search) which is available through a user-friendly interface and (i) converts raw data into a format for visualization on a genome browser, (ii) outputs ranked peak locations using a statistically based method that overcomes the significant problem of false positives, (iii) identifies the gene nearest to each peak, (iv) classifies the location of each peak relative to gene structure, (v) provides information such as the number of binding sites per chromosome and per gene and (vi) allows the user to determine overlap between two different experiments. In addition, the program performs an analysis of amplified and deleted regions of the input genome. This software is web-based and automated, allowing easy and immediate access to all investigators. We demonstrate the utility of our software by collecting, analyzing and comparing ChIP-seq data for six different human transcription factors/cell line combinations.


Figures

Figure 1.
Figure 1.
Sole-Search schema. A user can upload one Solexa raw data file into the online program or can upload several files and have the data merged into one file for analysis. The program parses the data and gives the user a summary report which details the number of reads, the number of reads that match the human genome and the number of unique reads. A message is also provided indicating that the remainder of the analysis results will be provided via email when the analysis is completed. Next, two background models are created to reflect the test sample submitted. The first background model reflects all regions of the genome that are both unique and sequenceable. The second model reflects the biased sequencing of input from that cell type. In the first step of the program, the duplicated and deleted regions of the genome are determined and background and ChIP tag counts are normalized to reflect a single copy. In the second step, a peak height threshold is determined based on background model 1 and a false discovery rate (0.0001 or 0.001 is recommended). The most significant peaks determined in the first pass are removed from the background model and this step is repeated for an accurate height cutoff. In the third step, peaks are determined significant over background model 2. Again, the most significant peaks determined in the first pass of this step are removed from the second background model, and this step is repeated, resulting in a final peaks list. After the second pass is complete, output is sent to the user via email. The files produced can be used as visualization tools (Figures 2 and 3) or for further analysis with additional online software (Figure 4). Shown on the top of the browser shots in each panel are the peaks called using Sole-Search and the peaks called if step 1, step 2 or step 3 of the program is removed (see also Supplementary Figure S9 for a larger view of each panel).
Figure 2.
Figure 2.
Visualization of ChIP-seq data using Sole-Search output files. ChIP-seq data for the merged TCF4 replicate dataset were analyzed using Sole-Search (Table 1). Shown for a region of chromosome 1 is: (Peaks) the visualization file (signifpeaks.gff) indicating the called peaks; (TCF4 reduced binning) the visualization file (redbin.sgr) of the tags that correspond only to regions called as peaks, and (TCF4 raw binning) the visualization file (rawbinning.sgr) of all binned and mapped tags. The inset shows the same files, but with an expanded view of a region of chromosome 1. The rawbinning.sgr files are provided for each individual chromosome, due to their large size (e.g. the size of the TCF4 chromosome 1 rawbinning.sgr file is 64.1 MB). However, the redbin.sgr file and the signifpeaks.gff file are much smaller (e.g. the size of the TCF4 redbin.sgr file, which shows TCF4 peaks for all chromosomes, is only 4.5 Mb) and are provided as single files for the entire genome, for ease in comparing different datasets.
Figure 3.
Figure 3.
Identification of amplified and deleted regions of the genome. Shown for a region of chromosome 13 is the visualization file (smear.sgr) that allows easy detection of the amplified and deleted regions of the genome being analyzed, a file showing the regions called as duplicated (duplications.gff), and a file showing the deleted regions of the genome (deletions.gff).
Figure 4.
Figure 4.
Step-wise analysis of ChIP-seq data. Shown are the steps taken to analyze the E2F4 ChIP-seq data. First, each replicate was analyzed separately (Supplementary Folders S1 and S2) using Sole-Search, then the replicate peak lists were sorted by peak height and truncated to the same length. Then, the two peak lists were compared using the Overlap analysis Tool (Supplementary Folder S7). The overlap was determined to be 74% and then Sole-Search was repeated, inputting both replicates using the option to merge the replicate files (Supplementary Folder S3). The peaks were then characterized using the Location-Analysis tool (Supplementary Folder S9 and Figure S6).
Figure 5.
Figure 5.
Comparison of peak calling by different programs. (A) Peaks were called using the 12 917 986 uniquely mapped tags from the E2F4 merged dataset using Sole-Search, PeakSeq and Sissrs (either with or without using a background; note that only 3 of the 5 lanes of input could be used with Sissrs because the program could not handle the larger number of reads but all 5 lanes were used with the other two programs). The Venn diagram shows the number of peaks called by each program and the relative overlap of the different datasets. (B) Shown for a region of chromosome 1 is the sgr visualization file for the K562 input sample, the E2F4 ChIP sample and the peaks called by each program. (C) Shown for a region of chromosome 9 is the sgr visualization file for the K562 input sample, the E2F4 ChIP sample, and the peaks called by each program; note the very large number of peaks called by PeakSeq and Sissrs in the amplified genomic region.
Figure 6.
Figure 6.
Comparison of E2F4 and E2F6 binding sites. The signifpeaks.gff files for the merged E2F4 and merged E2F6 datasets were uploaded into the Gff-Overlap Tool, using 0 nt distance (Supplementary Folder S15). (A) The ∼15 000 binding sites that were identified (using the overlapping peaks file from the Overlap Analysis Tool) to be bound by both E2F4 and E2F6 in K562 cells were analyzed using the Location-Analysis Tool (Supplementary Folder S16). A graphical representation of the dist_analysis file is shown. (B) The top 1000 of the ∼12 000 E2F6-specific binding sites that were identified (using the non-overlapping peaks file from the Overlap Analysis Tool) were analyzed using the Location-Analysis Tool (Supplementary folder S17). A graphical representation of the dist_analysis file is shown.
Figure 7.
Figure 7.
Comparison of YY1 binding sites in two different cell types. The YY1 binding sites (signifpeaks.gff) identified using Sole-Search for K562 cells (Supplementary Folder S18) and for Ntera2 cells (Supplementary Folder S19) were compared using the Overlap Analysis Tool (Supplementary Folder S20). Shown for a region of chromosome 1 is the sgr visualization file for the YY1 ChIP-seq data from K562 and from Ntera2. Also shown for this region are the peaks that are common to both cell types and the peaks that are specific for each cell type.
Figure 8.
Figure 8.
Using the Sole-Search Tool set to identify enhanceosomes. A location analysis of the 17 118 AP2α peaks and 21 102 TCF4 peaks was performed using the Location-Analysis Tool. The 6272 AP2α and 6682 TCF4 enhancer sites (defined as ±10 to 100 kb from the start site of a gene) were then compared using the Overlap Tool. The number of sites identified when the spacing between TCF4 and AP2α sites was varied between 0 kb (peaks must overlap) to 10 kb is shown in the top panel. Also shown are examples of AP2α and TCF4 peaks, all of them far from start sites of genes, that overlap by 0, <1 kb or <5 kb.
Figure 9.
Figure 9.
Motif analysis of TCF4 ChIP-seq data. The signifpeaks.gff file for the merged TCF4 dataset was analyzed using the Location Analysis Tool (Supplementary Folder S10). Then, the sites corresponding to promoters (±2 kb from a transcription start site) or enhancers (±10 to 100 kb from a start site) were selected. Each set was then analyzed using Meme for de novo motif identification. As shown in (A), the three motifs identified in the enhancer binding sites correspond to known motifs for AP-1 (TGAGTCA), TCF4 (T/ATCAAAG) and ETS-1 (G/CAGGAAG). (B) The similar binding patterns of TCF4 (HCT116 cells) and JUN (K562 cells) across a region of chromosome 1. Also shown for that region of chromosome 1 are the overlapping sites identified when the Gff-Overlap Tool was used to compare the TCF4 and JUN peak files and the TCF4 and JUN motifs identified in the TCF4 peaks.

References

    1. Boyd KE, Farnham PJ. Myc versus USF: Discrimination at the cad gene is determined by core promoter elements. Mol. Cell. Biol. 1997;17:2529–2537. - PMC - PubMed
    1. Grandori C, Mac J, Siebelt F, Ayer DE, Eisenman RN. Myc-Max heterodimers activate a DEAD box gene and interact with multiple E box-related sites in vivo. EMBO J. 1996;15:4344–4357. - PMC - PubMed
    1. Squazzo SL, Komashko VM, O’Geen H, Krig S, Jin VX, Jang S-W, Green R, Margueron R, Reinberg D, Farnham PJ. Suz12 silences large regions of the genome in a cell type-specific manner. Genome Res. 2006;16:890–900. - PMC - PubMed
    1. Oberley MJ, Inman D, Farnham PJ. E2F6 negatively regulates BRCA1 in human cancer cells without methylation of histone H3 on lysine 9. J. Biol. Chem. 2003;278:42466–42476. - PubMed
    1. Kirmizis A, Bartley SM, Kuzmichev A, Margueron R, Reinberg D, Green R, Farnham PJ. Silencing of human polycomb target genes is associated with methylation of histone H3 lysine 27. Genes Dev. 2004;18:1592–1605. - PMC - PubMed

Publication types

Substances