

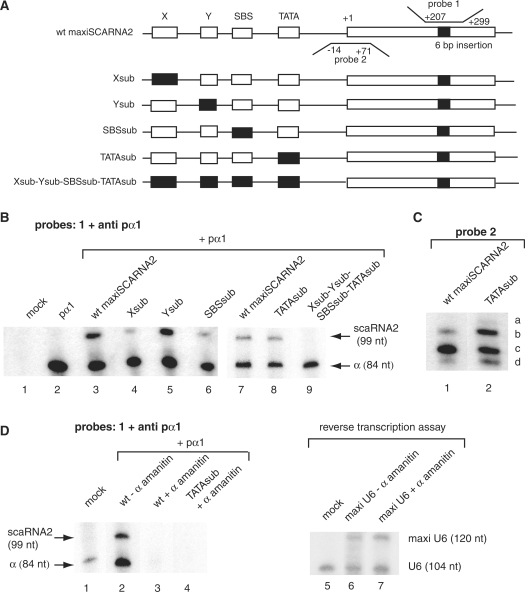
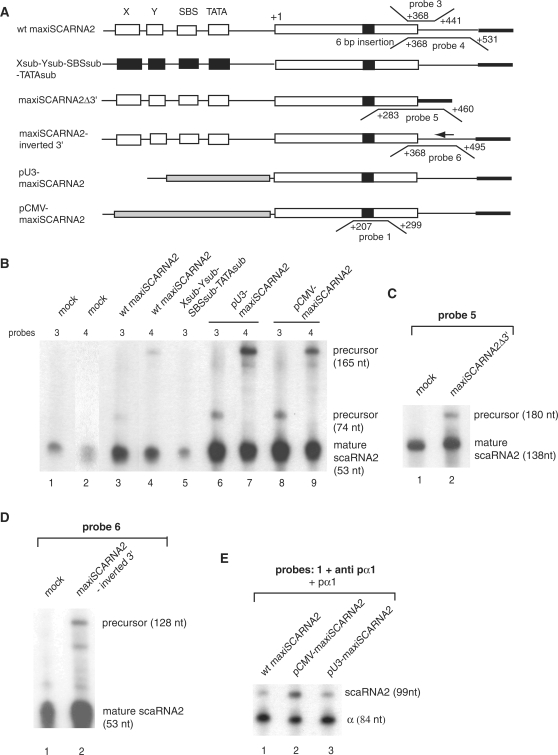
The scaRNA2 is produced by an independent transcription unit and its processing is directed by the encoding region
- PMID: 19906720
- PMCID: PMC2811027
- DOI: 10.1093/nar/gkp988
The scaRNA2 is produced by an independent transcription unit and its processing is directed by the encoding region
Abstract
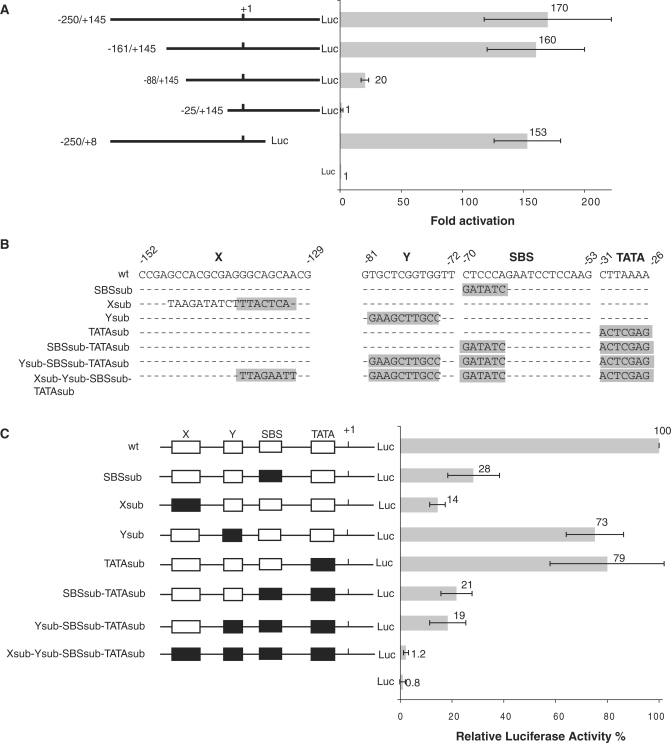
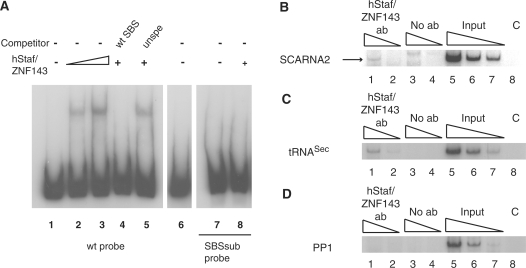
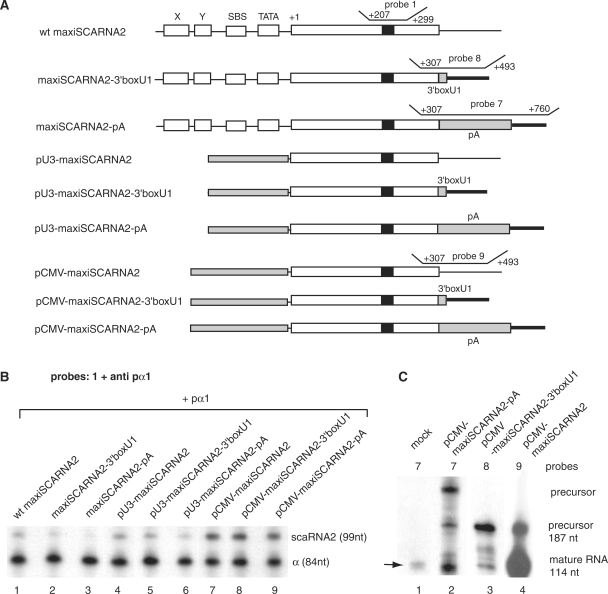
The C/D box scaRNA2 is predicted to guide specific 2'-O-methylation of U2 snRNA. In contrast to other SCARNA genes, SCARNA2 appears to be independently transcribed. By transient expression of SCARNA2-reporter gene constructs, we have demonstrated that this gene is transcribed by RNA polymerase II and that the promoter elements responsible for its transcription are contained within a 161 bp region upstream of the transcription start site. In mammals, we have identified four cross species conserved promoter elements, a TATA motif, an hStaf/ZNF143 binding site and two novel elements that are required for full promoter activity. Binding of the human hStaf/ZNF143 transcription factor to its target sequence is required for promoter activity, suggesting that hStaf/ZNF143 is a fundamental regulator of the SCARNA2 gene. We also showed that RNA polymerase II continues transcription past the 3'-end of the mature RNA, irrespective of the identity of the Pol II promoter. The 3'-end processing and accumulation are governed by the sole information contained in the scaRNA2 encoding region, the maturation occurring via a particular pathway incompatible with that of mRNA or snRNA production.
Figures
Similar articles
-
Genome-wide evidence for an essential role of the human Staf/ZNF143 transcription factor in bidirectional transcription.Nucleic Acids Res. 2011 Apr;39(8):3116-27. doi: 10.1093/nar/gkq1301. Epub 2010 Dec 21. Nucleic Acids Res. 2011. PMID: 21177654 Free PMC article.
-
Transcription of the human cell cycle regulated BUB1B gene requires hStaf/ZNF143.Nucleic Acids Res. 2007;35(10):3453-64. doi: 10.1093/nar/gkm239. Epub 2007 May 3. Nucleic Acids Res. 2007. PMID: 17478512 Free PMC article.
-
U6 snRNA genes of Arabidopsis are transcribed by RNA polymerase III but contain the same two upstream promoter elements as RNA polymerase II-transcribed U-snRNA genes.Nucleic Acids Res. 1990 Jun 25;18(12):3451-8. doi: 10.1093/nar/18.12.3451. Nucleic Acids Res. 1990. PMID: 2362802 Free PMC article.
-
Expression of human snRNA genes from beginning to end.Biochem Soc Trans. 2008 Aug;36(Pt 4):590-4. doi: 10.1042/BST0360590. Biochem Soc Trans. 2008. PMID: 18631122 Review.
-
Core promoter-selective RNA polymerase II transcription.Biochem Soc Symp. 2006;(73):225-36. doi: 10.1042/bss0730225. Biochem Soc Symp. 2006. PMID: 16626302 Review.
Cited by
-
Identification of processing elements and interactors implicate SMN, coilin and the pseudogene-encoded coilp1 in telomerase and box C/D scaRNP biogenesis.RNA Biol. 2016 Oct 2;13(10):955-972. doi: 10.1080/15476286.2016.1211224. Epub 2016 Jul 15. RNA Biol. 2016. PMID: 27419845 Free PMC article.
-
Small Cajal body-associated RNA 2 (scaRNA2) regulates DNA repair pathway choice by inhibiting DNA-PK.Nat Commun. 2022 Feb 23;13(1):1015. doi: 10.1038/s41467-022-28646-5. Nat Commun. 2022. PMID: 35197472 Free PMC article.
-
Coilin association with Box C/D scaRNA suggests a direct role for the Cajal body marker protein in scaRNP biogenesis.Biol Open. 2014 Apr 15;3(4):240-9. doi: 10.1242/bio.20147443. Biol Open. 2014. PMID: 24659245 Free PMC article.
-
Regulatory RNPs: a novel class of ribonucleoproteins that potentially contribute to ribosome heterogeneity.Biol Open. 2017 Sep 15;6(9):1342-1354. doi: 10.1242/bio.028092. Biol Open. 2017. PMID: 28808137 Free PMC article.
-
Molecular determinants that govern scaRNA processing by Drosha/DGCR8.Biol Open. 2020 Oct 26;9(10):bio054619. doi: 10.1242/bio.054619. Biol Open. 2020. PMID: 33037012 Free PMC article.
References
-
- Maden BE, Hughes JM. Eukaryotic ribosomal RNA: the recent excitement in the nucleotide modification problem. Chromosoma. 1997;105:391–400. - PubMed
-
- Smith CM, Steitz JA. Sno storm in the nucleolus: new roles for myriad small RNPs. Cell. 1997;89:669–672. - PubMed
-
- Kiss-Laszlo Z, Henry Y, Bachellerie JP, Caizergues-Ferrer M, Kiss T. Site-specific ribose methylation of preribosomal RNA: a novel function for small nucleolar RNAs. Cell. 1996;85:1077–1088. - PubMed
Publication types
MeSH terms
Substances
LinkOut - more resources
Full Text Sources
Miscellaneous
