

Protein Geometry Database: a flexible engine to explore backbone conformations and their relationships to covalent geometry
- PMID: 19906726
- PMCID: PMC2808862
- DOI: 10.1093/nar/gkp1013
Protein Geometry Database: a flexible engine to explore backbone conformations and their relationships to covalent geometry
Abstract
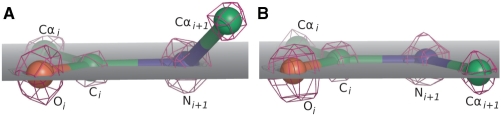
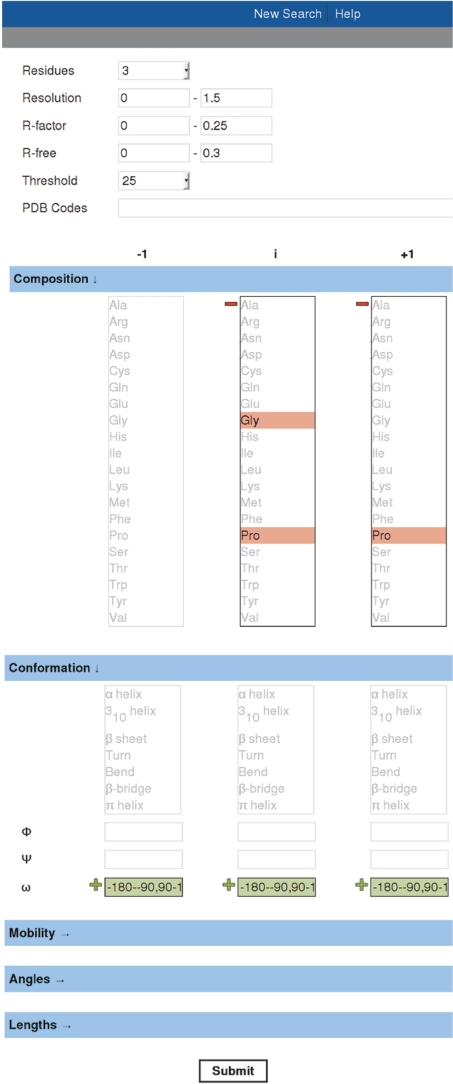
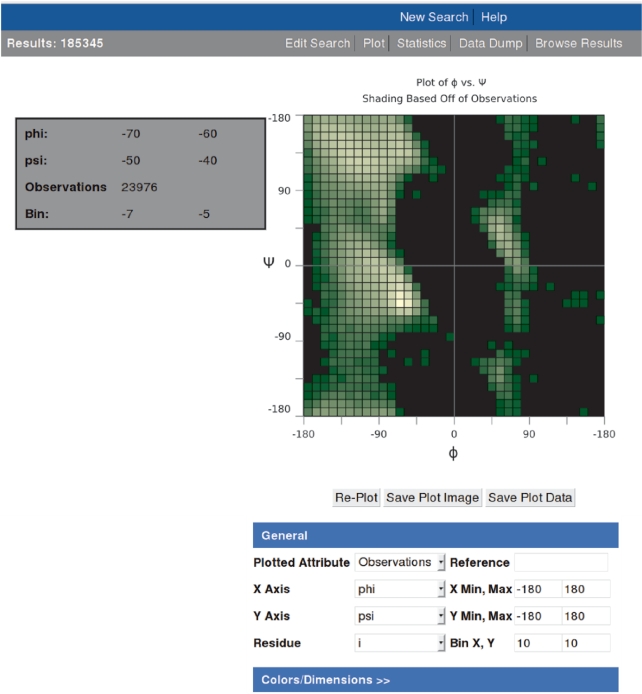
The backbone bond lengths, bond angles, and planarity of a protein are influenced by the backbone conformation (varphi,Psi), but no tool exists to explore these relationships, leaving this area as a reservoir of untapped information about protein structure and function. The Protein Geometry Database (PGD) enables biologists to easily and flexibly query information about the conformation alone, the backbone geometry alone, and the relationships between them. The capabilities the PGD provides are valuable for assessing the uniqueness of observed conformational or geometric features in protein structure as well as discovering novel features and principles of protein structure. The PGD server is available at http://pgd.science.oregonstate.edu/ and the data and code underlying it are freely available to use and extend.
Figures
Similar articles
-
MeMotif: a database of linear motifs in alpha-helical transmembrane proteins.Nucleic Acids Res. 2010 Jan;38(Database issue):D181-9. doi: 10.1093/nar/gkp1042. Epub 2009 Nov 12. Nucleic Acids Res. 2010. PMID: 19910368 Free PMC article.
-
SIMAP--a comprehensive database of pre-calculated protein sequence similarities, domains, annotations and clusters.Nucleic Acids Res. 2010 Jan;38(Database issue):D223-6. doi: 10.1093/nar/gkp949. Epub 2009 Nov 11. Nucleic Acids Res. 2010. PMID: 19906725 Free PMC article.
-
Inferred Biomolecular Interaction Server--a web server to analyze and predict protein interacting partners and binding sites.Nucleic Acids Res. 2010 Jan;38(Database issue):D518-24. doi: 10.1093/nar/gkp842. Epub 2009 Oct 20. Nucleic Acids Res. 2010. PMID: 19843613 Free PMC article.
-
ELM: the status of the 2010 eukaryotic linear motif resource.Nucleic Acids Res. 2010 Jan;38(Database issue):D167-80. doi: 10.1093/nar/gkp1016. Epub 2009 Nov 17. Nucleic Acids Res. 2010. PMID: 19920119 Free PMC article.
-
3DNALandscapes: a database for exploring the conformational features of DNA.Nucleic Acids Res. 2010 Jan;38(Database issue):D267-74. doi: 10.1093/nar/gkp959. Epub 2009 Nov 11. Nucleic Acids Res. 2010. PMID: 19906722 Free PMC article.
Cited by
-
Insights into Thiol-Aromatic Interactions: A Stereoelectronic Basis for S-H/π Interactions.J Am Chem Soc. 2017 Feb 8;139(5):1842-1855. doi: 10.1021/jacs.6b08415. Epub 2017 Jan 30. J Am Chem Soc. 2017. PMID: 28080040 Free PMC article.
-
(φ,ψ)₂ motifs: a purely conformation-based fine-grained enumeration of protein parts at the two-residue level.J Mol Biol. 2012 Feb 10;416(1):78-93. doi: 10.1016/j.jmb.2011.12.022. Epub 2011 Dec 16. J Mol Biol. 2012. PMID: 22198294 Free PMC article.
-
BriX: a database of protein building blocks for structural analysis, modeling and design.Nucleic Acids Res. 2011 Jan;39(Database issue):D435-42. doi: 10.1093/nar/gkq972. Epub 2010 Oct 23. Nucleic Acids Res. 2011. PMID: 20972210 Free PMC article.
-
Mass & secondary structure propensity of amino acids explain their mutability and evolutionary replacements.Sci Rep. 2017 Aug 10;7(1):7717. doi: 10.1038/s41598-017-08041-7. Sci Rep. 2017. PMID: 28798365 Free PMC article.
-
Ensemblator v3: Robust atom-level comparative analyses and classification of protein structure ensembles.Protein Sci. 2018 Jan;27(1):41-50. doi: 10.1002/pro.3249. Epub 2017 Aug 11. Protein Sci. 2018. PMID: 28762605 Free PMC article.
References
-
- Lawson CL. An atomic view of the L-tryptophan binding site of trp repressor. Nat. Struct. Biol. 1996;3:986–987. - PubMed
-
- Merritt EA, Kuhn P, Sarfaty S, Erbe JL, Holmes RK, Hol WG. The 1.25 A resolution refinement of the cholera toxin B-pentamer: evidence of peptide backbone strain at the receptor-binding site. J. Mol. Biol. 1998;282:1043–1059. - PubMed
-
- Esposito L, Vitagliano L, Zagari A, Mazzarella L. Experimental evidence for the correlation of bond distances in peptide groups detected in ultrahigh-resolution protein structures. Protein Eng. 2000;13:825–828. - PubMed
Publication types
MeSH terms
Substances
Grants and funding
LinkOut - more resources
Full Text Sources
Molecular Biology Databases
Miscellaneous
