. 2010 Mar;27(3):570-80.
doi: 10.1093/molbev/msp274. Epub 2009 Nov 11.

Bayesian inference of species trees from multilocus data

Affiliations

Bayesian inference of species trees from multilocus data

Joseph Heled et al. Mol Biol Evol. 2010 Mar.

Abstract

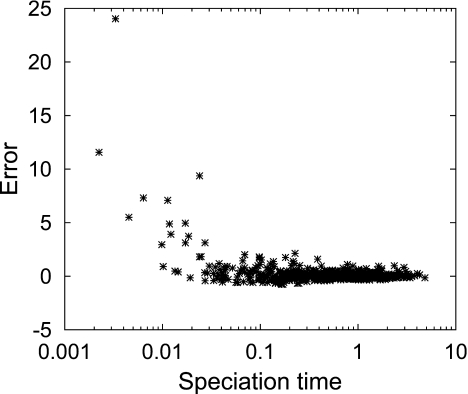
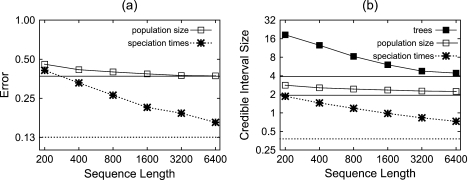
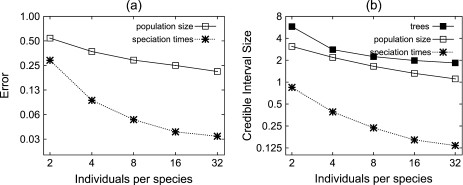
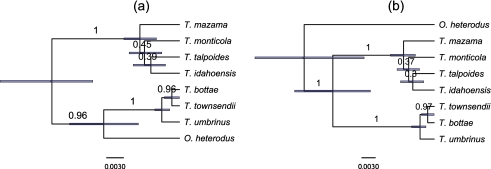
Until recently, it has been common practice for a phylogenetic analysis to use a single gene sequence from a single individual organism as a proxy for an entire species. With technological advances, it is now becoming more common to collect data sets containing multiple gene loci and multiple individuals per species. These data sets often reveal the need to directly model intraspecies polymorphism and incomplete lineage sorting in phylogenetic estimation procedures. For a single species, coalescent theory is widely used in contemporary population genetics to model intraspecific gene trees. Here, we present a Bayesian Markov chain Monte Carlo method for the multispecies coalescent. Our method coestimates multiple gene trees embedded in a shared species tree along with the effective population size of both extant and ancestral species. The inference is made possible by multilocus data from multiple individuals per species. Using a multiindividual data set and a series of simulations of rapid species radiations, we demonstrate the efficacy of our new method. These simulations give some insight into the behavior of the method as a function of sampled individuals, sampled loci, and sequence length. Finally, we compare our new method to both an existing method (BEST 2.2) with similar goals and the supermatrix (concatenation) method. We demonstrate that both BEST and our method have much better estimation accuracy for species tree topology than concatenation, and our method outperforms BEST in divergence time and population size estimation.


Figures

F<sc>IG</sc>. 1.
FIG. 1.
Species tree visualization. One locus for three individuals from each of the three species giving a total of nine samples. Current population size (t = 0) of A is 2 and at time 1.5 (where it split from B) the population size is 1.
F<sc>IG</sc>. 2.
FIG. 2.
(a) A simulated species tree from a birth–death process with continuous population sizes. (b) A single gene tree embedded inside the same species tree.
F<sc>IG</sc>. 3.
FIG. 3.
(a) Species tree estimation error and (b) 95% credible interval size as a function of the number of loci. The number of individuals sampled per species is four for all experiments. Each graph point is obtained by averaging the error measure (described in the main text) over 100 analyses of simulated data sets. The “branch score” is a measure of the distance in tree space of the estimated species tree to the true tree, incorporating both topology and divergence times. The “tree score” is a measure of the distance between the estimated species tree and the true species tree incorporating information about the population size as well. For details of the tree metrics used, see main text.
F<sc>IG</sc>. 4.
FIG. 4.
(a) Relative error and (b) credible interval size for both population size and speciation time point estimates. The number of individuals sampled per species is four for all experiments. Each graph point is obtained by averaging over 100 analyses of simulated data sets (see main text for details).
F<sc>IG</sc>. 5.
FIG. 5.
Speciation time estimate error as a function of speciation time. Data are taken from the main 100 runs with two loci, four individuals per species, and the sequence length of 1,600 bp.
F<sc>IG</sc>. 6.
FIG. 6.
(a) Relative error and (b) credible interval sizes as a function of sequence length. The number of individuals sampled per species is four for all experiments. The number of independent loci are four for all experiments. Each graph point is obtained by averaging over 100 analyses of simulated data sets. The horizontal line represents the theoretical maximum when sequence length approaches infinity and is calculated by using the gene trees directly without error.
F<sc>IG</sc>. 7.
FIG. 7.
(a) Relative error and (b) credible interval sizes, as a function of number of individuals sample from each species. Each graph point is obtained by averaging over 100 analyses of simulated data sets. The analysis used the true gene trees to reduce the computational cost.
F<sc>IG</sc>. 8.
FIG. 8.
Phylogeny for seven groups of western pocket gophers (Geomyidae, Thomomys). The analysis is based on seven noncoding nuclear genes from 28 individuals. Clade posterior probability is indicated on the branch. (a) Analysis with no monophyly constraints and (b) analysis with ingroup monophyly enforced.
F<sc>IG</sc>. 9.
FIG. 9.
Western pocket gophers (Geomyidae, Thomomys) species tree with embedded gene trees, each in a different color. The species tree was generated using median estimates for the divergence times and population sizes. Note that this representation is for the purpose of visual inspection only, and any inferences should be made directly from the posterior data.

Similar articles

Cited by

References

    1. Belfiore NM, Liu L, Moritz C. Multilocus phylogenetics of a rapid radiation in the genus Thomomys (Rodentia: Geomyidae) Syst Biol. 2008;57(2):294. - PubMed
    1. Das A, Mohanty S, Stephan W. Inferring the population structure and demography of Drosophila ananassae from multilocus data. Genetics. 2004;168(4):1975–1985. - PMC - PubMed
    1. Degnan JH, DeGiorgio M, Bryant D, Rosenberg NA. Properties of consensus methods for inferring species trees from gene trees. Syst Biol. 2009;58(1):35. - PMC - PubMed
    1. Degnan JH, Rosenberg NA. Discordance of species trees with their most likely gene trees. PLoS Genet. 2006 2(5):e68. - PMC - PubMed
    1. Degnan JH, Rosenberg NA. Gene tree discordance, phylogenetic inference and the multispecies coalescent. Trends Ecol Evol. 2009;24(6):332–340. - PubMed

Publication types