Review
. 2009 Dec;136(23):3853-62.
doi: 10.1242/dev.035139.

Non-genetic heterogeneity of cells in development: more than just noise

Affiliations
Review

Non-genetic heterogeneity of cells in development: more than just noise

Sui Huang. Development. 2009 Dec.

Abstract

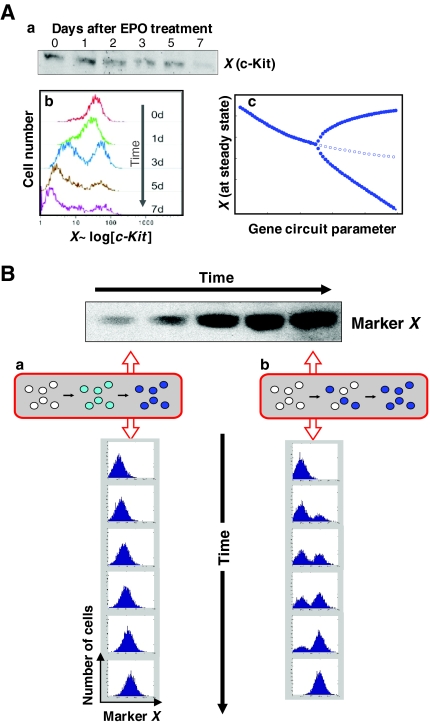
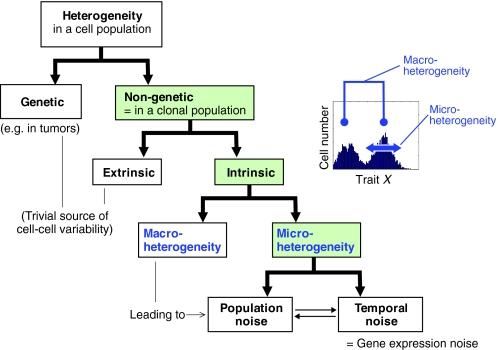
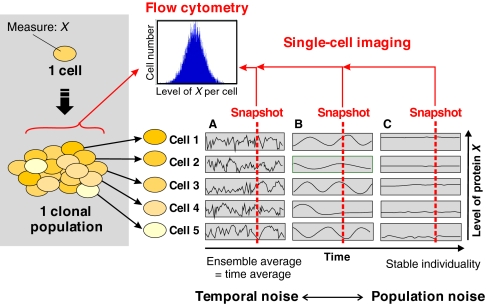
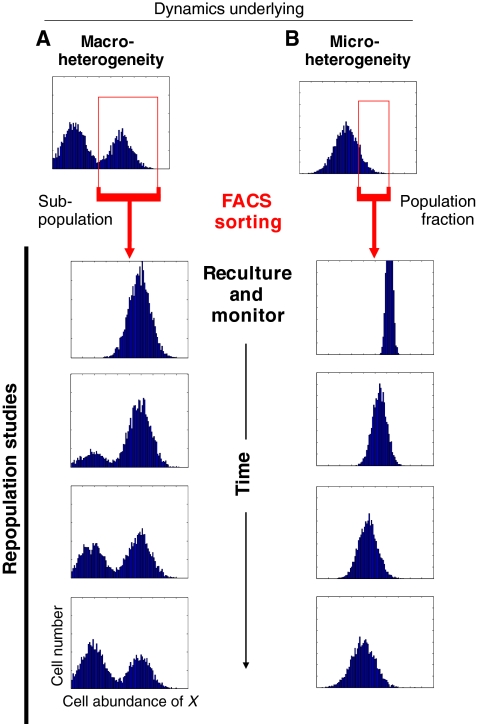
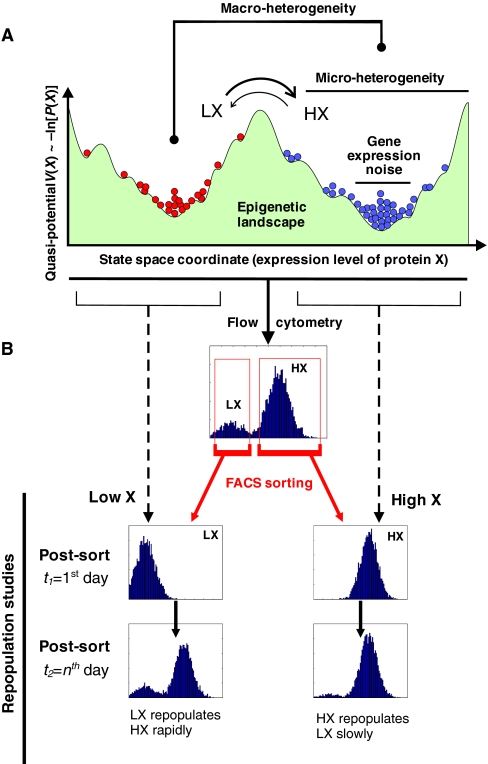
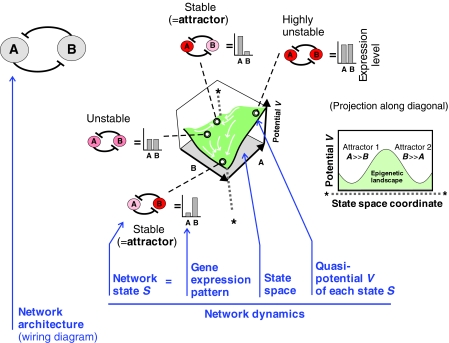
Cell-to-cell variability of gene expression in clonal populations of mammalian cells is ubiquitous. However, because molecular biologists habitually assume uniformity of the cell populations that serve as starting material for experimental analysis, attention to such non-genetic heterogeneity has been scant. As awareness of, and interest in, understanding its biological significance increases, this Primer attempts to clarify the confusing terminologies used in an emerging field that often conflates heterogeneity with noise, and provides a qualitative introduction to the fundamental dynamic principles that underlie heterogeneity. It thus aims to present a useful conceptual framework to organize, analyze and communicate observations made at the resolution of individual cells that indicate that heterogeneity of cell populations plays a biological role, such as in multipotency and cell fate decision.


Figures

Fig. 1.
Fig. 1.
Population-averaging versus individual-cell-based measurements of protein levels. (A) Examples of information masked when population-averaging methods, such as western blotting, are used to measure changes in protein levels. Hematopoietic progenitor cells were treated with erythropoietin (EPO) to induce erythroid differentiation, and c-Kit levels were monitored over time. (a) Western blotting shows a decrease in overall c-Kit levels. (b) Flow cytometry reveals the temporal progression of the population distribution of c-Kit surface expression. (c) A bifurcation diagram could explain the separation of the population into c-Kit-low and c-Kit-high subpopulations (solid lines), even though the overall levels decrease (dotted line). (B) Flow cytometry analysis at the individual cell level distinguishes between (a) a continuous increase in protein in each cell and (b) the non-synchronous near all-or-none (ON-OFF) switching of protein expression. Both give rise to the apparently gradual increase in the band intensity in the western blot shown. The gradual increase in band intensity in b arises from the statistical, non-synchronous switching on of expression, reflecting the fraction of cells in the population that are in the ON-state, as contained in the lysate used for the western blot. In reality, even a formal all-or-none response has a finite switch time, but the change in expression levels is still very steep, and true intermediate levels that are not due to mixing of asynchronously switching cells would be seen only at the single-cell level in dense-interval monitoring, observation at the population level being obscured by asynchrony.
Fig. 2.
Fig. 2.
Cell population heterogeneity. A schematic representation of terminologies and concepts used in the study of cell population heterogeneity, organized into a hierarchy of dichotomies: genetic versus non-genetic heterogeneity; extrinsic versus intrinsic non-genetic heterogeneity; macro-versus micro-heterogeneity within intrinsic non-genetic heterogeneity; and population versus temporal noise within micro-heterogeneity (for details, see text and Box 1, Glossary). The inset represents a flow cytometry histogram that reveals a bimodal distribution, which reflects two distinct subpopulations.
Fig. 3.
Fig. 3.
Trait heterogeneity in cell populations and at the individual cell level. (A-C) Two approaches can in principle be applied to the analysis at the individual cell level of a cell population heterogeneous with respect to a trait X (e.g. the cellular abundance of a particular protein, as represented by shades of yellow): population distribution versus single-cell real-time tracking. Note that the ensemble snapshot provided by flow cytometry does not distinguish between the possible scenarios in individual cells. (A) Fast stochastic fluctuations attributable to gene expression noise. (B) Asynchronous, possibly deterministic, oscillations. (C) Fixed cell individuality. The two extremes of this spectrum represent (A) temporal noise and (B) population noise.
Fig. 4.
Fig. 4.
Analyzing the dynamics underpinning non-genetic heterogeneity. (A,B) Schematic representation of fluorescence-activated cell sorting (FACS), based on simulations. The sorting and reculturing of a subpopulation in the case of (A) macro-heterogeneity, or of a tail fraction (‘outliers’) in the case of (B) micro-heterogeneity, can provide information on the nature of the processes that generate heterogeneity among clonal cells. (A) The presence of multiple separate peaks (representing subpopulations) with respect to a single trait X does not imply the presence of inconvertible, irreversibly committed cell types. Often, transitions occur. (B) Typically, outliers in mammalian cell populations slowly (within time frames of up to several days) repopulate the naïve distribution, which indicates the presence of an attractor state in a rugged epigenetic landscape (see Fig. 5). The rate at which a subpopulation repopulates the entire distribution (including subpopulations) provides information about the transition rate between distinct subpopulations.
Fig. 5.
Fig. 5.
The epigenetic landscape and practical implications for network dynamics. (A) A projected epigenetic landscape with two attractors [low X (LX), high X (HX)] and their sub-attractors, which contribute to heterogeneity (see Box 2). Each circle represents a network state (i.e. a cellular phenotype) determined by the level of X as indicated by the position on the horizontal axis (i.e. one state space dimension, trait X, of the high-dimensional state space). The vertical axis displays the ‘potential’ V (X), as explained in Boxes 1 and 2. The height of the accumulation of circles reflects the density distribution as a function of X. (B) Associated flow cytometry histograms of cell population distributions with respect to X. Subpopulation sorting (see Fig. 4) can reveal the reversibility and the transition rates between the subpopulations.
None

References

    1. Aird W. C. (2004). Endothelial cell heterogeneity: a case for nature and nurture. Blood 103, 3994
    1. Aurell E., Sneppen K. (2002). Epigenetics as a first exit problem. Phys. Rev. Lett. 88, 048101 - PubMed
    1. Austin D. W., Allen M. S., McCollum J. M., Dar R. D., Wilgus J. R., Sayler G. S., Samatova N. F., Cox C. D., Simpson M. L. (2006). Gene network shaping of inherent noise spectra. Nature 439, 608-611 - PubMed
    1. Balaban N. Q., Merrin J., Chait R., Kowalik L., Leibler S. (2004). Bacterial persistence as a phenotypic switch. Science 305, 1622-1625 - PubMed
    1. Baldinger K. (1980). Semantic Theory Oxford: Blackwell;