. 2010 Feb;103(2):677-97.
doi: 10.1152/jn.90946.2008. Epub 2009 Nov 11.

Spatial and temporal features of synaptic to discharge receptive field transformation in cat area 17

Affiliations

Spatial and temporal features of synaptic to discharge receptive field transformation in cat area 17

Lionel G Nowak et al. J Neurophysiol. 2010 Feb.

Abstract

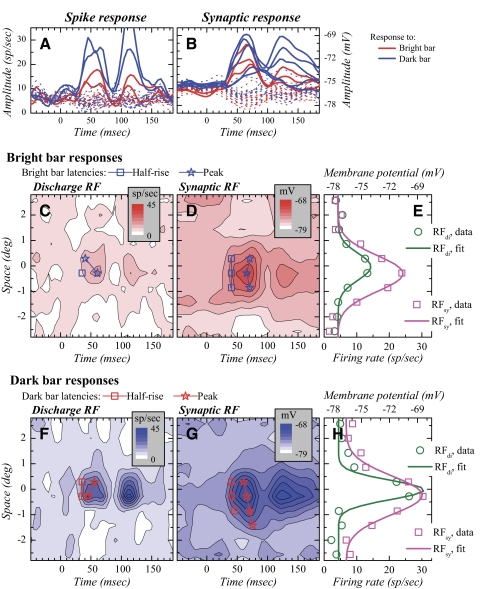
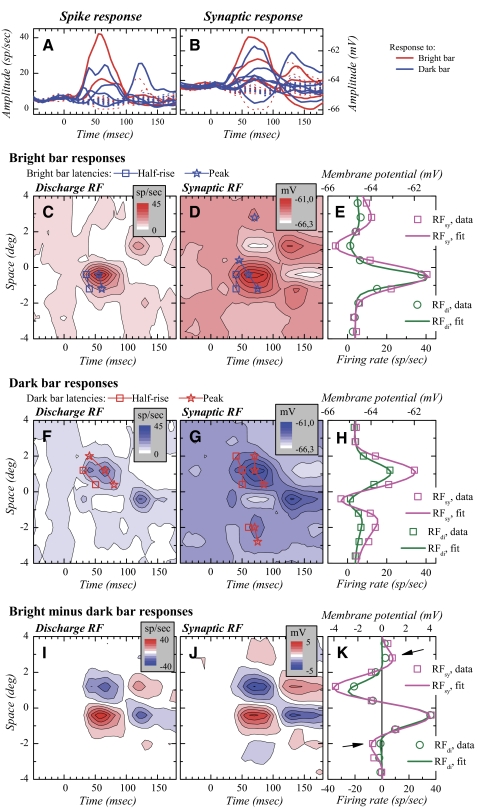
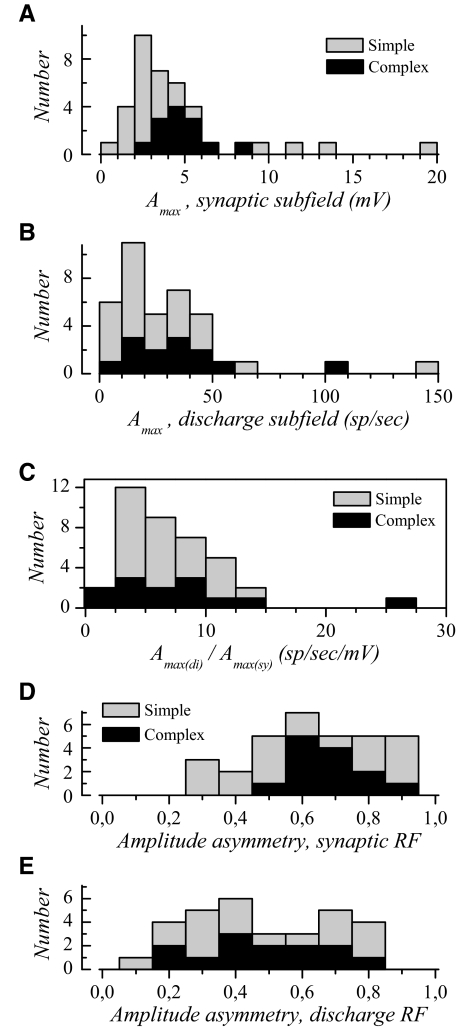
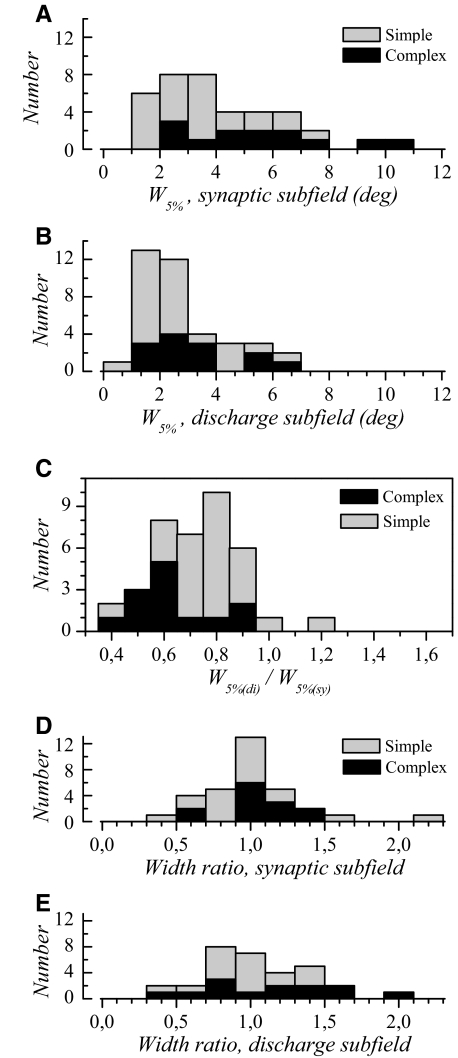
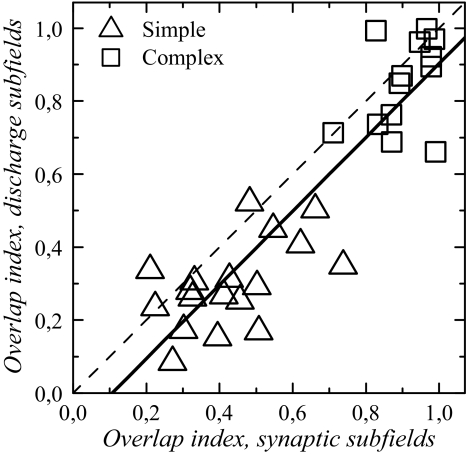
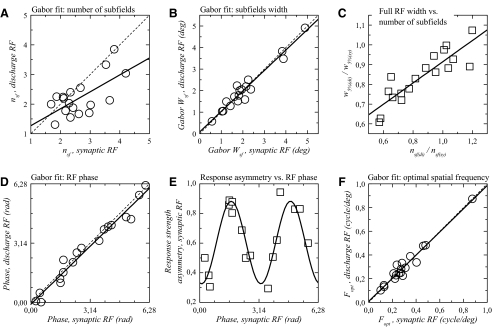
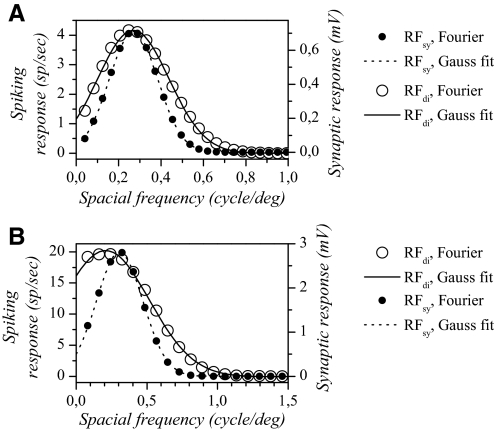
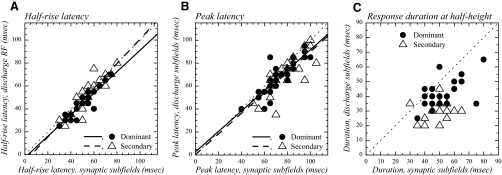
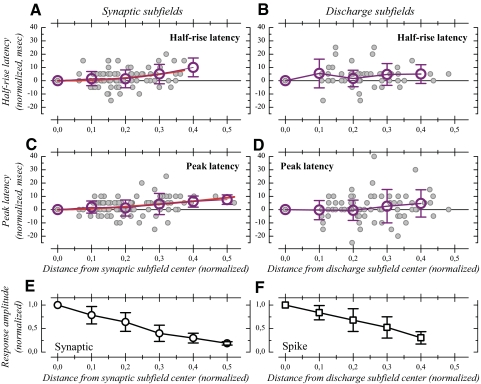
The aim of the present study was to characterize the spatial and temporal features of synaptic and discharge receptive fields (RFs), and to quantify their relationships, in cat area 17. For this purpose, neurons were recorded intracellularly while high-frequency flashing bars were used to generate RFs maps for synaptic and spiking responses. Comparison of the maps shows that some features of the discharge RFs depended strongly on those of the synaptic RFs, whereas others were less dependent. Spiking RF duration depended poorly and spiking RF amplitude depended moderately on those of the underlying synaptic RFs. At the other extreme, the optimal spatial frequency and phase of the discharge RFs in simple cells were almost entirely inherited from those of the synaptic RFs. Subfield width, in both simple and complex cells, was less for spiking responses compared with synaptic responses, but synaptic to discharge width ratio was relatively variable from cell to cell. When considering the whole RF of simple cells, additional variability in width ratio resulted from the presence of additional synaptic subfields that remained subthreshold. Due to these additional, subthreshold subfields, spatial frequency tuning predicted from synaptic RFs appears sharper than that predicted from spiking RFs. Excitatory subfield overlap in spiking RFs was well predicted by subfield overlap at the synaptic level. When examined in different regions of the RF, latencies appeared to be quite variable, but this variability showed negligible dependence on distance from the RF center. Nevertheless, spiking response latency faithfully reflected synaptic response latency.


Figures

Fig. 1.
Fig. 1.
Discharge and synaptic receptive fields (RFs) in complex cells. A: time course of the spiking response to the presentation of the bright (red traces) and dark bars (blue traces) in 16 spatial positions across and beyond the RF. Solid lines correspond to responses that were significant by our criteria and dotted lines to responses that were not. Time 0 corresponds to stimulus onset. The first peaks (30–100 ms) correspond to the responses to the onset of the stimulus (“on” response) and the second peaks (>100 ms) to the responses to stimulus extinction (“off” response). B: time course of the synaptic responses in the same cell. C: response to the bright flashing bar shown as a space–time map for the spiking response. D: response to the bright flashing bar shown as a space–time map for the membrane potential response. In C and D, half-rise and peak latencies are represented as a function of space by squares and stars, respectively. E: bright bar RF profiles taken at the time of the maximum “on” response in the maps. Experimental data are shown as circles (spiking response) and squares (synaptic response). Continuous lines correspond to Gaussians fitted to the data. FG: same as CE for the response to the dark bar.
Fig. 2.
Fig. 2.
Discharge and synaptic RFs in a simple cell. Conventions for AH as for Fig. 1. In E and H, experimental data have been fitted using pairs of difference-of-Gaussians (DOGs). I and J: subtraction of the dark bar response map from the bright bar response map. In these subtracted maps, an increase in red saturation represents increased response to the bright bar and an increase in blue saturation represents increased response to the dark bar, scaled negatively due to the subtraction. K: synaptic and discharge RF profiles taken at the time of maximal “on” response in the subtracted maps. The data have been fitted with Gabor functions.
Fig. 3.
Fig. 3.
Amplitude of visual responses in synaptic and discharge RFs. Data in A and B correspond to the amplitude of the Gaussian curves fitted to the dominant subfield in simple and complex cells (Amax). A: distribution of Amax in the dominant synaptic subfield in simple (gray bars) and complex cells (dark bars). B: distribution of Amax in the dominant discharge subfield. C: distribution of the ratio of peak firing rate divided by maximal depolarization amplitude. D: ratio of secondary to dominant Amax distribution for the synaptic subfields. E: ratio of secondary to dominant Amax for discharge subfields.
Fig. 4.
Fig. 4.
Subfield widths for synaptic and spiking responses. A: distribution of the widths (w5%) determined for dominant synaptic subfields in simple (gray bars) and complex cells (dark bars). B: distribution of w5% for dominant discharge subfields in simple and complex cells. C: discharge to synaptic subfield width ratio. Almost all values are <1, indicating that synaptic subfields are larger than discharge subfields. D and E: primary and secondary subfields are on average of similar width. Width ratio distribution is shown in D for the synaptic responses and in E for the spiking responses.
Fig. 5.
Fig. 5.
Subfield overlap indices (OIs) for spiking and discharge RFs are well correlated. Solid line: regression line. The regression equation is: OI(di) = −0.108 + 1.011 × OI(sy), with the indices “di” and “sy” referring to discharge and synaptic RFs, respectively. Dashed line represents equality line.
Fig. 6.
Fig. 6.
A: number of subfields (nsf) in synaptic and discharge RFs of Gabor-fitted simple cells. The scatterplot and linear regression analysis illustrate the dependence of discharge nsf on synaptic nsf. For the majority of cells, the values are below the equality line (dashed line), implying that synaptic RFs in a majority of simple cells possessed subfields that were subthreshold for spike generation. B: subfield widths derived from Gabor function fitted to simple cell RFs (wsf). In contrast to those determined from Gaussian fits (Fig. 4), subfield widths are very similar for synaptic and discharge RFs. Regression equation: wsf(di) = 0.083 + 0.951 × wsf(sy). C: ratio of the spiking to synaptic whole RF width (w5%) plotted against spiking to synaptic number of subfields ratio. The significant correlation indicates that, in simple cells, the variability in the discharge to synaptic RF width ratio is well explained by the number of synaptic subfields that did not induce spiking responses. D: phases of synaptic and discharge RFs of simple cells fitted with Gabor functions. The scatterplot and regression analysis demonstrate that the discharge RF phase is almost completely determined by the phase of the synaptic RF. The regression equation is: φdi = −0.102 + 0.979 × φsy. E: relationship between responses strength asymmetry (Fig. 3D) and synaptic RF phase. The data have been fitted with a sinusoid. One cell from D does not appear due to lack of measurable response with individual Gaussian fit for one of the two bar contrasts. F: optimal spatial frequency (Fopt) determined from Gabor fits in simple cells. The regression equation is: Fopt(di) = −0.008 + 0.978 × Fopt(sy). Dashed lines in A, B, D, and F represent equality line.
Fig. 7.
Fig. 7.
Examples of spatial frequency tuning curves predicted from synaptic and discharge static RFs in 2 simple cells. A: predicted tuning for the simple cell shown in Fig. 2. B: predicted tuning for the simple cell shown in Supplemental Fig. S2. Open symbols represent the result of the Fourier transform on the Gabor used to fit the discharge RFs and closed symbols the result of the Fourier transform on the Gabor used to fit the synaptic RFs. Continuous lines represent the Gaussian fits made on the Fourier transforms of the discharge RFs and dashed lines those made on the Fourier transforms of the synaptic RFs. For both cells, the spatial frequency tuning width predicted from the synaptic RF appears narrower than that predicted from the discharge RF.
Fig. 8.
Fig. 8.
AC: predicted high-frequency cutoff (pFhigh) is smaller for tuning curves predicted from synaptic RFs compared with that predicted from discharge RFs. A: distribution of pFhigh for synaptic RFs. B: distribution of pFhigh for discharge RFs. C: correlation between synaptic and discharge pFhigh values. DF: low spatial frequency cutoff (pFlow) is higher for tuning curves predicted from synaptic RFs compared with that predicted from discharge RFs. D: pFlow distribution for synaptic RFs. E: pFlow distribution for discharge RFs. F: correlation between synaptic and discharge pFlow values. GJ: bandwidths of predicted spatial frequency tuning curves (pBWs) are smaller when predicted from synaptic RFs compared with those predicted from discharge RFs. G: distribution of pBW for synaptic RFs. H: pBW distribution for discharge RFs. I: correlation between bandwidth predicted from synaptic and spiking RFs. J: distribution of predicted discharge to synaptic bandwidths ratios. K: ratio of the number of subfields exhibited in discharge vs. synaptic RFs is plotted against the ratio of discharge to synaptic pBW. The difference between synaptic and discharge pBW values is well explained by the difference in subfield number in synaptic and spiking RFs. The significant correlation and negative slope indicate that the difference in pBW values increases when the difference in subfield number between synaptic and discharge RFs increases. Dashed lines in C, F, and I represent equality line.
Fig. 9.
Fig. 9.
Half-rise latency, peak latency, and response duration. Dominant subfields are represented by black circles and secondary subfields by open triangles. A: half-rise latency in discharge subfields as a function of half-rise latency in synaptic subfields. The continuous line corresponds to the regression line for the dominant subfields and the dashed line is the regression line obtained for the secondary subfields. B: peak latency in discharge subfields is strongly correlated with peak latency in synaptic subfields. Continuous and dashed lines: regression lines for dominant and secondary subfields, respectively. C: response duration in discharge subfields as a function of response duration in synaptic subfields. The two variables are weakly correlated. The dotted line is not a regression line and represents duration equality, to help illustrate the fact that discharge RF durations are nearly systematically lower than synaptic RF durations. The numbers of data points in A, B, and C may appear lower than the sample sizes given in text because latencies were determined in 5-ms steps, such that cells displaying identical latencies or durations are represented by points that overlap.
Fig. 10.
Fig. 10.
Normalized latencies as a function of normalized space. A and C: half-rise and peak latency for membrane potential responses as a function of distance from subfield center expressed in fraction of synaptic subfield width. B and D: half-rise and peak latency for spiking responses as a function of distance expressed in fraction of spiking subfield width. In AD, individual latency values are indicated by gray dots; open symbols and associated error bars show the means ± 1SD of the latencies calculated for different bins of the normalized subfield width: 0–0.05, 0.05–0.15, 0.15–0.25, and so forth. For synaptic responses (A, C), the relationship between distance and latency (individual data) has been examined with a power function and the best-fit line is shown in red. E: means and SDs of the normalized amplitude of synaptic responses represented as a function of normalized distance for synaptic responses. F: same as E for discharge subfields.

Similar articles

Cited by

References

    1. Albus K. A quantitative study of the projection area of the central and the paracentral visual field in area 17 of the cat. I. The precision of the topography. Exp Brain Res 24: 159–179, 1975 - PubMed
    1. Alonso JM, Martinez LM. Functional connectivity between simple cells and complex cells in cat striate cortex. Nat Neurosci 1: 395–403, 1998 - PubMed
    1. Alonso JM, Usrey WM, Reid RC. Rules of connectivity between geniculate cells and simple cells in cat primary visual cortex. J Neurosci 21: 4002–4015, 2001 - PMC - PubMed
    1. Anderson JS, Lampl I, Gillespie DC, Ferster D. The contribution of noise to contrast invariance of orientation tuning in cat visual cortex. Science 290: 1968–1972, 2000 - PubMed
    1. Andrews BW, Pollen DA. Relationship between spatial frequency selectivity and receptive field profile of simple cells. J Physiol 287: 163–176, 1979 - PMC - PubMed

Publication types

LinkOut - more resources