. 2010 Jan;103(1):25-37.
doi: 10.1152/jn.00458.2009. Epub 2009 Nov 11.

Interneuron circuits tune inhibition in retinal bipolar cells

Affiliations

Interneuron circuits tune inhibition in retinal bipolar cells

Erika D Eggers et al. J Neurophysiol. 2010 Jan.

Abstract

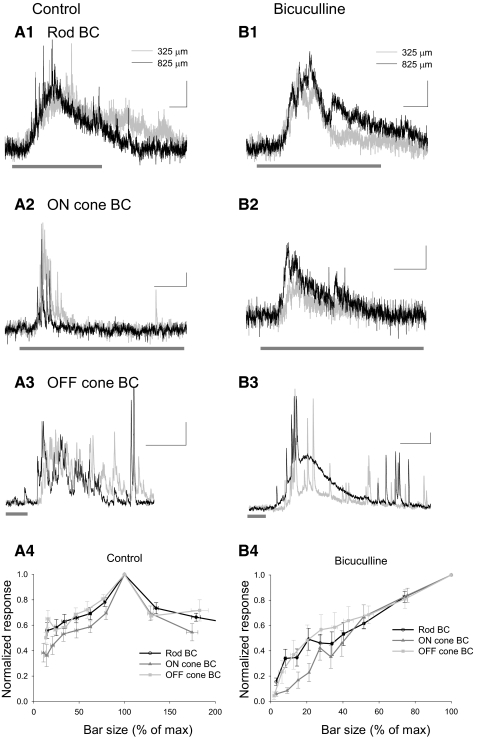
While connections between inhibitory interneurons are common circuit elements, it has been difficult to define their signal processing roles because of the inability to activate these circuits using natural stimuli. We overcame this limitation by studying connections between inhibitory amacrine cells in the retina. These interneurons form spatially extensive inhibitory networks that shape signaling between bipolar cell relay neurons to ganglion cell output neurons. We investigated how amacrine cell networks modulate these retinal signals by selectively activating the networks with spatially defined light stimuli. The roles of amacrine cell networks were assessed by recording their inhibitory synaptic outputs in bipolar cells that suppress bipolar cell output to ganglion cells. When the amacrine cell network was activated by large light stimuli, the inhibitory connections between amacrine cells unexpectedly depressed bipolar cell inhibition. Bipolar cell inhibition elicited by smaller light stimuli or electrically activated feedback inhibition was not suppressed because these stimuli did not activate the connections between amacrine cells. Thus the activation of amacrine cell circuits with large light stimuli can shape the spatial sensitivity of the retina by limiting the spatial extent of bipolar cell inhibition. Because inner retinal inhibition contributes to ganglion cell surround inhibition, in part, by controlling input from bipolar cells, these connections may refine the spatial properties of the retinal output. This functional role of interneuron connections may be repeated throughout the CNS.


Figures

Fig. 1.
Fig. 1.
Retinal inhibitory circuits. A: bipolar cells (BCs) in the inner nuclear layer (INL) receive excitatory input from photoreceptors located in the outer nuclear layer (ONL) through synapses in outer plexiform layer (OPL). BCs then release glutamate onto downstream ganglion cells (GCs) and amacrine cells (ACs). BCs also receive direct inhibition from ACs to GABAA (■) and GABAC (□) receptors (R). Inhibitory synapses are marked by a minus sign. This inhibition is regulated by serial connections between inhibitory ACs in the retina, mediated by GABAARs (■). Both direct and serial inhibition modulate glutamate release from BCs onto GCs in the GC layer (GCL), the output neurons of the retina. B: BC types were identified as rod (B1), on cone (B2), or off cone (B3) BCs by labeling with sulforhodamine (scale bar, 10 μm). ···, borders of the IPL. C: GABAergic light-evoked inhibitory postsynaptic currents (L-IPSCs) recorded from a rod BC (in the presence of strychnine). Because GABAAR-mediated serial connections suppress BC inhibition, blocking the connections with a GABAAR antagonist (bicuculline) leads to an increase in L-IPSCs (189 ± 74%, n = 11, P < 0.05). The full-field light-emitting diode (LED) light stimulus (1000 ms) is marked (formula image
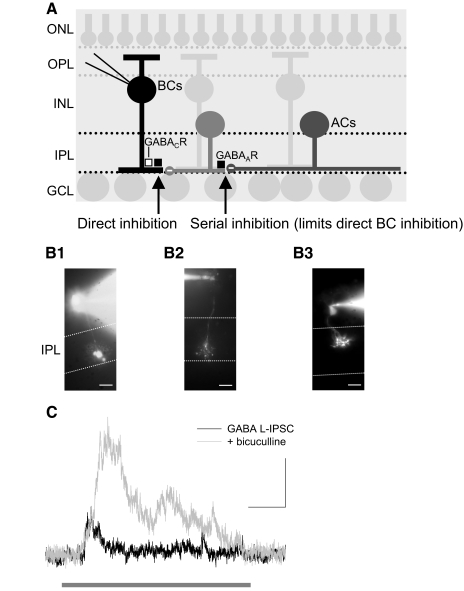
). Scale bars are 200 ms and 5 pA.
Fig. 2.
Fig. 2.
Serial connections limit wide-field but not narrow-field BC L-IPSCs. Wide-field (825 μm, A) and narrow-field (25 μm, B) light stimuli (A1 and B1 and thick dark gray bar in traces) were applied to rod, on cone, and off cone BCs. Bicuculline (50 μM) was added to block GABAARs. In all BC types, blocking GABAARs increased the charge transfer (Q) of wide-field L-IPSCs (A and C), suggesting that serial inhibitory connections between ACs limit wide-field light activated L-IPSCs (rod, P < 0.05; on, P < 0.05; off, P < 0.05). In contrast, blocking GABAARs decreased the Q of narrow-field L-IPSCs (B and D), suggesting narrow-field light activated only direct connections (rod, n = 10, P < 0.001; on, n = 6, P < 0.01; off, n = 5, P < 0.05). Inset in B1 is the trace in B1 at an increased scale. The scale bars are 200 ms and 10 pA in A, 1 and 3, B, 1 and 3; 5 pA in A2 and B2. The dotted line represents control in C and D.
Fig. 3.
Fig. 3.
Local feedback inhibition to rod BCs is not suppressed by GABAAR-mediated serial connections. Feedback-IPSCs (fIPSCs) to rod BCs were measured by depolarizing a rod BC briefly (500 ms) from −60 to 0 mV. fIPSCs were partially blocked in different rod BCs by both (1,2,5,6-tetrahydropyridine-4yl) methyphosphinic acid (TPMPA; A and C, n = 5; Q, P < 0.001) and bicuculline (B and C, n = 4; Q, P < 0.001, different cells than in A), suggesting they are mediated by both GABAARs and GABACRs. Blocking GABACRs significantly decreased the decay of the currents (C, P < 0.001), while blocking GABAARs significantly decreased the peak of the currents (C, P < 0.0001). However, blocking GABAARs caused no increase in the currents, suggesting these local fIPSCs are not suppressed by serial connections. Traces were normalized to the baseline at the end of the trace, after current had decayed. Scale bars are 100 ms and 10 pA (A), 20 pA (B).
Fig. 4.
Fig. 4.
ACs receive inputs onto GABAA and glycine receptors but not GABAC receptors. A: when both glycine and GABAA receptors were blocked, all of the inhibitory current in ACs was blocked. B: in this AC example, little of the current was blocked by strychnine, suggesting it receives primarily GABAAR-mediated. C: in this AC example, little of the current was blocked by bicuculline, suggesting that the current was primarily mediated by glycine receptors. In all figures, the scale bars are 10 pA and 200 ms. D: average proportion of the total current carried by glycine receptors, GABAARs and GABACRs.
Fig. 5.
Fig. 5.
GABAAR-mediated serial connections limit only GABACR-mediated input in rod and on cone BCs but also limit glycineR-mediated input in off cone BCs. Light (825 μm) was applied to all BC types. In rod and on cone BCs (A and B), when GABACRs were 1st blocked using TPMPA, adding bicuculline caused no increase in the Q of L-IPSCs (C and D), showing that the GABAAR-mediated serial connections only limit GABACR-mediated inputs (rod, n = 6, P < 0.05; on, n = 4, P < 0.001). In contrast, in off cone BCs, the addition of bicuculline still caused an increase in L-IPSC Q (D) due to the increase in glycine-receptor-mediated inputs (off, n = 4, P < 0.05). The change with bicuculline in the presence of TPMPA was significantly greater in off cone BCs than rod and on cone BCs (ANOVA P < 0.001, Scheffe on vs. off P < 0.001, rod vs. off P < 0.01). Scale bars are 200 ms and 5 pA (A and B; 10 pA (D).
Fig. 6.
Fig. 6.
The spatial responses of BC L-IPSCs are suppressed at large light stimulus sizes in control conditions but not when serial connections are blocked by bicuculline. Light stimuli of 10 different sizes (25 μm–825 μm) were applied to BCs in control and bicuculline, and the Q of each L-IPSC was measured. A: in all BC types in control, intermediate-sized light stimuli in (examples at 325 μm shown here) gave the maximum L-IPSC (A) instead of the largest light size (825 μm). The average ARFs of all BCs recorded were normalized to the maximum light response for each BC and to the light size where the maximum response was elicited (A4). ARFs showed a peak at an intermediate-sized light stimuli for all BC types in control (rod, n = 19; on, n = 14; off, n = 9). B: when GABAAR-mediated serial connections are blocked, BC L-IPSCs show no suppression. In the same cells as in A, 1–3, bicuculline was added to block serial connections. In contrast to the recordings in control conditions, in all BC types, the largest L-IPSCs were observed at the largest light stimulus size (825 μm) instead of the intermediate-sized light stimuli (325 μm shown here). The average ARFs of all BCs recorded in bicuculline were calculated (B4), and showed an increasing light response with increasing light stimulus size (rod, n = 11; on, n = 5; off, n = 5). This suggests that the spatial tuning seen in control conditions is due to limiting BC L-IPSCs by serial connections. Scale bars are 200 ms and 5 pA (A, 1 and 2, and B, 1 and 2); 25 pA (A3 and B3).
Fig. 7.
Fig. 7.
Serial connections significantly suppress BC L-IPSCs and create a maximum response at intermediate light stimuli sizes. A suppression index (SI, A) and the light stimulus size that elicited the maximum L-IPSC (B) were calculated from the ARFs of each recorded BC in control and bicuculline. A: in control conditions, the SI was significantly >1 for all BC types (rod, n = 19; P < 0.0001; on, n = 14, P < 0.01; off, n = 9, P < 0.01), showing significant suppression of large-sized light stimuli, while in bicuculline, the SI = 1, showing no suppression (rod, n = 11, P = 0.8; on, n = 5, P = 1; off, n = 5, P = 0.3). B: similarly, in control, the size of light stimulus eliciting the maximal L-IPSC was significantly less than the maximum light stimulus size (825 μm) in all BC types (rod, P < 0.0001; on, P < 0.0001; off, P < 0.01). In bicuculline, the light stimulus size that elicited the maximal L-IPSC was not different from 825 μm, the largest size of light stimulus used (rod, P = 0.2; on, P = 1; off, P = 0.2). Thus when serial connections were blocked by bicuculline, the suppression of L-IPSCs by large light stimuli was not observed.
Fig. 8.
Fig. 8.
Suppression by serial connections increases with increasing light stimulus size. A: the average response of rod BCs in control solution where serial synapses are active (as in Fig. 6A1), shows a peak at intermediate light sizes (n = 19). The average response was fit with a modified Gaussian curve to enable comparisons across groups of cells. Responses for all curves were normalized to the maximum control response. B: the average response of rod BC in bicuculline, where serial synapses have been blocked, shows an increase with increasing light size (n = 8). Here the response has been fit with a sigmoidal function for comparison. C: the average GABAAR-mediated contribution to the total light response estimated by subtracting the response in bicucuclline+TPMPA from the response in TPMPA (n = 6). D: using the fitted curves in A–C, we can calculate how the total inhibition to rod BCs when serial connections are blocked is compared with the response when serial connections are active. The average light size at maximum was used to make the x axis. In A–D, the response is normalized to the maximum response in control. In A–C, the stimulus is normalized to light size that gives the maximum response in control.

Similar articles

Cited by

References

    1. Ashmore JF, Copenhagen DR. Different postsynaptic events in two types of retinal bipolar cell. Nature 288: 84–86, 1980 - PubMed
    1. Barlow HB, Derrington AM, Harris LR, Lennie P. The effects of remote retinal stimulation on the responses of cat retinal ganglion cells. J Physiol 269: 177–194, 1977 - PMC - PubMed
    1. Barlow HB, Levick WR. Threshold setting by the surround of cat retinal ganglion cells. J Physiol 259: 737–757, 1976 - PMC - PubMed
    1. Chavez AE, Singer JH, Diamond JS. Fast neurotransmitter release triggered by Ca influx through AMPA-type glutamate receptors. Nature 443: 705–708, 2006 - PubMed
    1. Chichilnisky EJ, Kalmar RS. Functional asymmetries in on and off ganglion cells of primate retina. J Neurosci 22: 2737–2747, 2002 - PMC - PubMed

Publication types

MeSH terms

LinkOut - more resources