. 2010 Jan;152(1):226-44.
doi: 10.1104/pp.109.148965. Epub 2009 Nov 11.

Developmental stage specificity and the role of mitochondrial metabolism in the response of Arabidopsis leaves to prolonged mild osmotic stress

Affiliations

Developmental stage specificity and the role of mitochondrial metabolism in the response of Arabidopsis leaves to prolonged mild osmotic stress

Aleksandra Skirycz et al. Plant Physiol. 2010 Jan.

Abstract

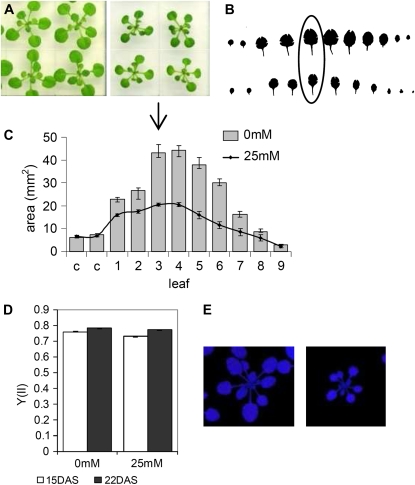
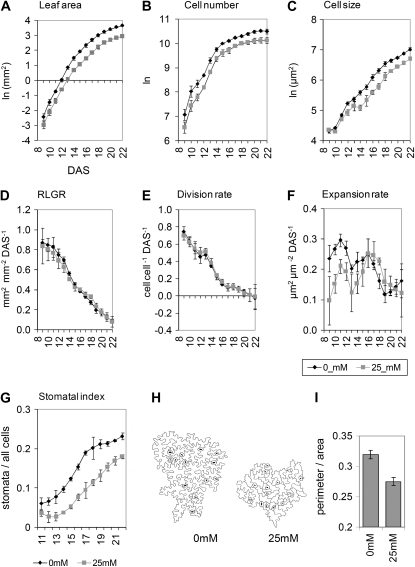
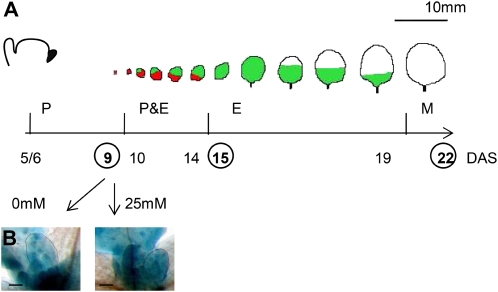
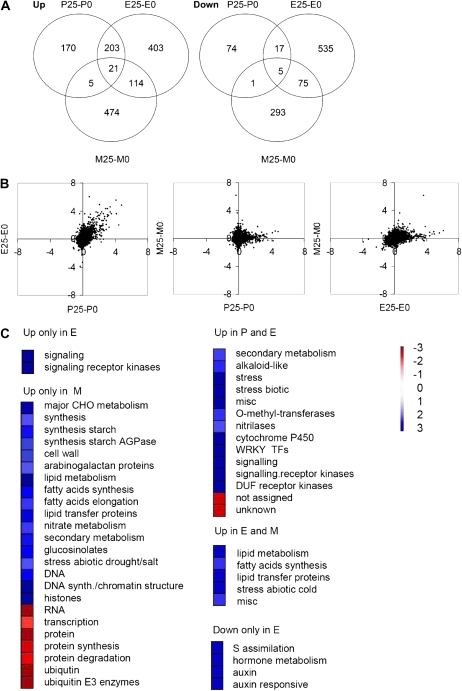
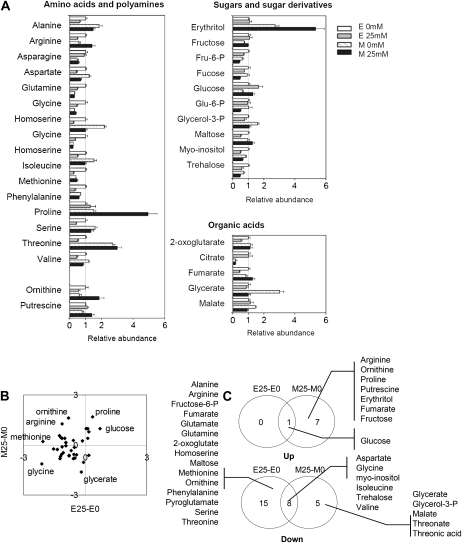
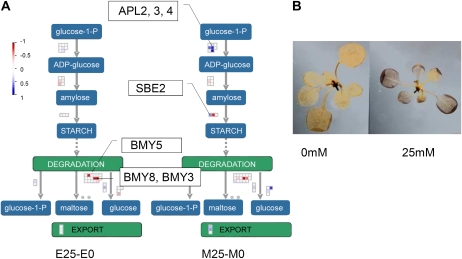
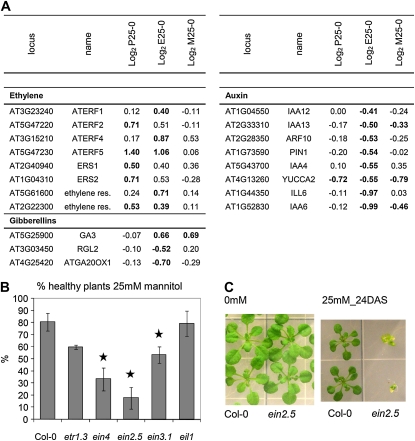
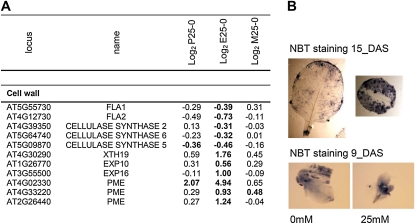
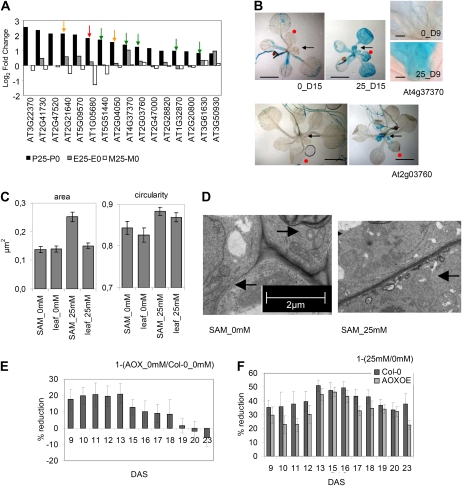
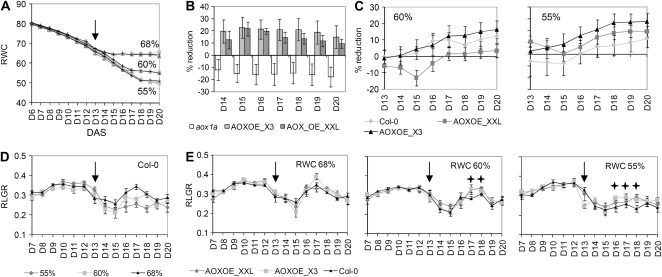
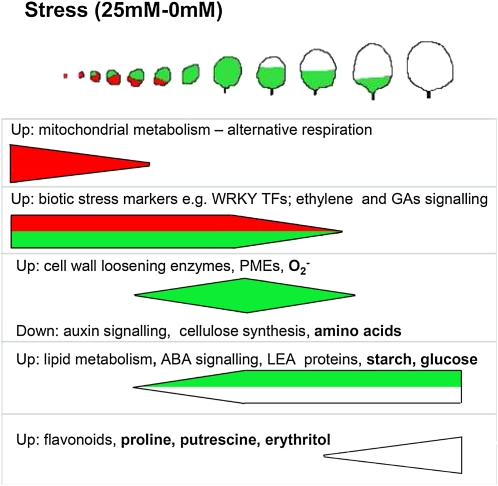
When subjected to stress, plants reprogram their growth by largely unknown mechanisms. To provide insights into this process, the growth of Arabidopsis (Arabidopsis thaliana) leaves that develop under mild osmotic stress was studied. Early during leaf development, cell number and size were reduced by stress, but growth was remarkably adaptable, as division and expansion rates were identical to controls within a few days of leaf initiation. To investigate the molecular basis of the observed adaptability, leaves with only proliferating, exclusively expanding, and mature cells were analyzed by transcriptomics and targeted metabolomics. The stress response measured in growing and mature leaves was largely distinct; several hundred transcripts and multiple metabolites responded exclusively in the proliferating and/or expanding leaves. Only a few genes were differentially expressed across the three stages. Data analysis showed that proliferation and expansion were regulated by common regulatory circuits, involving ethylene and gibberellins but not abscisic acid. The role of ethylene was supported by the analysis of ethylene-insensitive mutants. Exclusively in proliferating cells, stress induced genes of the so-called "mitochondrial dysfunction regulon," comprising alternative oxidase. Up-regulation for eight of these genes was confirmed with promoter:beta-glucuronidase reporter lines. Furthermore, mitochondria of stress-treated dividing cells were morphologically distinct from control ones, and growth of plants overexpressing the alternative oxidase gene was more tolerant to osmotic and drought stresses. Taken together, our data underline the value of analyzing stress responses in development and demonstrate the importance of mitochondrial respiration for sustaining cell proliferation under osmotic stress conditions.


Figures

Figure 1.
Figure 1.
Mannitol setup. A, Plants at 22 DAS grown in the absence (left) or presence (right) of 25 mm mannitol. B, Leaf series (third leaf encircled). C, Leaf area calculation. The arrow marks leaf 3 used in further analysis. D, Measurement of operating efficiency of PSII. E, Images of the effective PSII quantum yield (left, 0 mm; right, 25 mm).
Figure 2.
Figure 2.
Kinematic analysis of leaf 3 dissected from plants grown with or without 25 mm mannitol from 9 to 22 DAS. A, Leaf area. B, Cell number. C, Cell size. D, Relative leaf growth rate (RLGR). E, Relative cell division rate. F, Relative cell expansion rate. G, SI. H, Example of cell drawings of epidermal cells. I, Cell perimeter per cell area (perimeter/area) from epidermal cells. Data are means ± se of three independent experiments. Leaves 8 to 10 were used to measure leaf area. Cellular data are from four leaves in each experiment.
Figure 3.
Figure 3.
Experimental setup. A, Schematic representation of Arabidopsis leaf development. P cells, red; E cells, green; and M cells, white. The scale bar only applies to the leaves, not to the representation of the SAM. Leaf 3 initiates at approximately 5 DAS; all cells proliferate at 9 DAS, expand exclusively around 15 DAS, and approach maturity at 22 DAS, both under control and stress conditions. Samples for profiling analysis were dissected at 9, 15, and 22 DAS. B, GUS activity staining of leaf 3 from CYCB1;2-GUS plants at 9 DAS grown without or with 25 mm mannitol. The expression of CYCB1;2 is closely related to cell division activity.
Figure 4.
Figure 4.
Functional analysis of transcripts that are significantly affected by osmotic stress. A, Venn diagram grouping of genes differentially regulated by osmotic stress in P, E, and M leaves (global test; P < 0.05). B, Log2 fold changes (25–0 mm) for all analyzed genes (>20,000) used to construct scatter plots. Note the similarity between responses of P and E leaves and almost no overlap between P and M stages. C, Functional analysis with MapMan categories and the PageMan overrepresentation tool. Significantly enriched or depleted functional groups are represented in blue or red, respectively. CHO, Carbohydrate; DUF, domain of unknown function.
Figure 5.
Figure 5.
Distinct metabolite profiles of E and M leaves subjected to osmotic stress are distinct. A, Relative abundance of all the measured metabolites. B, Log2 fold changes (25–0 mm) for all analyzed metabolites used to construct a scatter plot. C, Venn diagram with metabolites listed.
Figure 6.
Figure 6.
Increased starch levels in mannitol-grown plants. A, MapMan representation of starch metabolism. Red and blue, Down-regulated and up-regulated genes, respectively; E25-E0 and M25-M0, E and M leaves (25–0 mm), respectively. B, Lugol's staining of 15-DAS plants harvested 8 h into the day. Note intense blue staining of the mannitol-grown seedling.
Figure 7.
Figure 7.
Importance of ethylene signaling for stress tolerance of growing leaves. A, Expression changes for the selected genes involved in ethylene, GA, and auxin signaling and metabolism. Boldface indicates significance (global test; P < 0.05). B, Analysis of ethylene-insensitive mutants. Plants that developed a severe phenotype (curled pale leaves, growth arrest) were scored and used to calculate percentage of the “healthy”-looking seedlings. Stars indicate significance (t test; P < 0.05). Data are means ± se of multiple plates. C, Wild-type and ein2.5 plants grown on medium without or with 25 mm mannitol. [See online article for color version of this figure.]
Figure 8.
Figure 8.
Cell wall-related genes and superoxide levels affected by osmotic stress in the E leaves. A, Expression changes for the selected genes involved in cell wall metabolism. Boldface indicates significance (global test; P < 0.05). B, Superoxide levels visualized in leaf 3 from 9- and 15-DAS plants grown without (left) or with (right) mannitol stained with NBT. [See online article for color version of this figure.]
Figure 9.
Figure 9.
Importance of alternative respiration in P leaves. A, Log2 fold change of genes from the mitochondrial dysfunction regulon in long-term mannitol experiments measured in P, E, and M leaves. Arrows indicate genes used for promoter:GUS analysis; green, orange, and red arrows indicate expression validated by GUS staining, in one of two GUS lines, and not validated, respectively. B, Photographs of 15-DAS plants of two promoter:GUS lines. The arrows mark young, P leaves (note induction of both genes). The red dots indicate the third E leaf (note induction of At4g37370 gene only). Photographs of the third leaf from the 9-DAS At4g37370:GUS line showed a strong induction. C, Transmission electron micrographs of control and mannitol-grown plants (P leaf 3 and SAM) were used to calculate area and circularity of the mitochondria. Data are means ± se of 40 to 60 mitochondria. D, Transmission electron micrographs of SAM from control and mannitol-grown seedlings. Arrows point to mitochondria clusters. E and F, Leaf area measured for leaf 3 dissected from control (Col-0) and AOX1a-OE plants grown without or with 25 mm mannitol from 9 DAS until 22 DAS. Obtained data were used to calculate percentage reduction under control conditions (AOX-OE, 0 mm; Col-0, 0 mm; E) and stress conditions (25 mm/0 mm; F). Data are means ± se of eight to 10 leaves.
Figure 10.
Figure 10.
Less reduced growth of the AOX-OE plants during soil drought. A, RWC determined throughout the experiment (6–20 DAS) based on pot weight taken before watering. Stress treatment started at 13 DAS (arrow) when control plants were first watered to RWC of 68%. Black and gray lines, Col-0 and AOX-OE plants, respectively. B, Percentage reduction of AOX-OE and aox1a rosette area compared with wild-type (Col-0) plants measured under control conditions (RWC 68%). C, Percentage reduction of Col-0 and AOX-OE rosette area under mild (RWC 60%) and severe (RWC 55%) drought compared with control conditions from 13 to 20 DAS (duration of stress treatment). D, Relative growth rates (RLGR) of Col-0 under control and drought conditions. Note reduction of RLGR associated with stress onset (arrow). E, RLGR of Col-0 and AOX-OE plants under control and drought conditions. Arrows indicate start of stress treatment. Note the less reduced RLGR measured for AOX-OE plants (crosses). Data are means ± se from eight to 10 plants for each genotype and treatment. AOXOE_X3 and AOXOE_XXL are two independent AOX1a-overexpressing lines, while aox1a stands for the AOX1a knockout mutant.
Figure 11.
Figure 11.
Schematic representation of processes, genes, and metabolites (boldface) affected by stress (25–0 mm). PMEs, Pectin methyl esterases; TFs, transcription factors. Dark gray (red online), light gray (green online), and white represent P, E, and M cells, respectively. [See online article for color version of this figure.]

Comment in

Similar articles

Cited by

References

    1. Achard P, Cheng H, De Grauwe L, Decat J, Schoutteten H, Moritz T, Van Der Straeten D, Peng J, Harberd NP (2006) Integration of plant responses to environmentally activated phytohormonal signals. Science 311 91–94 - PubMed
    1. Achard P, Renou J-P, Berthomé R, Harberd NP, Genschik P (2008) Plant DELLAs restrain growth and promote survival of adversity by reducing the levels of reactive oxygen species. Curr Biol 18 656–660 - PubMed
    1. Aguirrezabal L, Bouchier-Combaud S, Radziejwoski A, Dauzat M, Cookson SJ, Granier C (2006) Plasticity to soil water deficit in Arabidopsis thaliana: dissection of leaf development into underlying growth dynamic and cellular variables reveals invisible phenotypes. Plant Cell Environ 29 2216–2227 - PubMed
    1. Arvidsson S, Kwasniewski M, Riaño-Pachón DM, Mueller-Roeber B (2008) QuantPrime—a flexible tool for reliable high-throughput primer design for quantitative PCR. BMC Bioinformatics 9 465. - PMC - PubMed
    1. Beemster GTS, De Veylder L, Vercruysse S, West G, Rombaut D, Van Hummelen P, Galichet A, Gruissem W, Inzé D, Vuylsteke M (2005) Genome-wide analysis of gene expression profiles associated with cell cycle transitions in growing organs of Arabidopsis. Plant Physiol 138 734–743 - PMC - PubMed

Publication types

Associated data