. 2009 Nov 11;29(45):14086-99.
doi: 10.1523/JNEUROSCI.0974-09.2009.

Hyperdopaminergic tone erodes prefrontal long-term potential via a D2 receptor-operated protein phosphatase gate

Affiliations

Hyperdopaminergic tone erodes prefrontal long-term potential via a D2 receptor-operated protein phosphatase gate

Tai-Xiang Xu et al. J Neurosci. .

Abstract

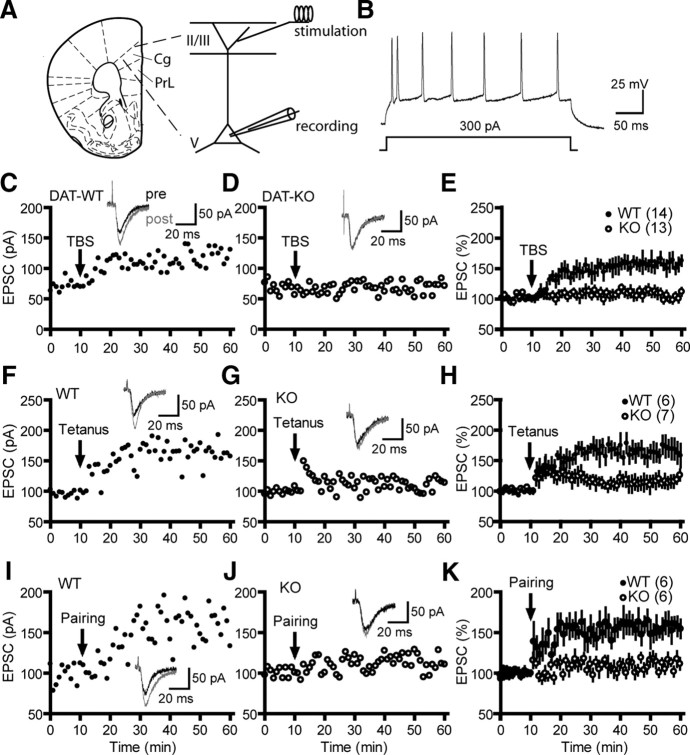
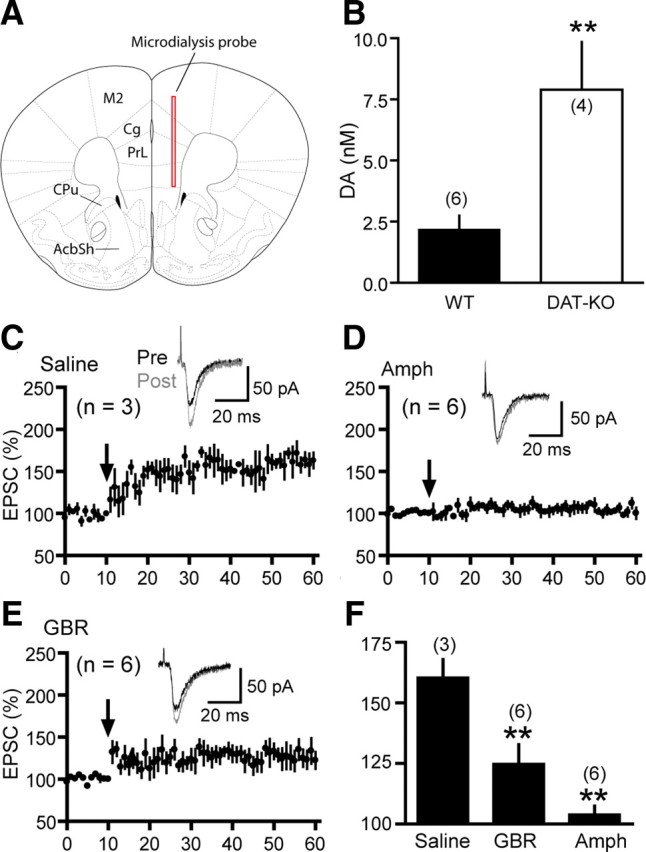
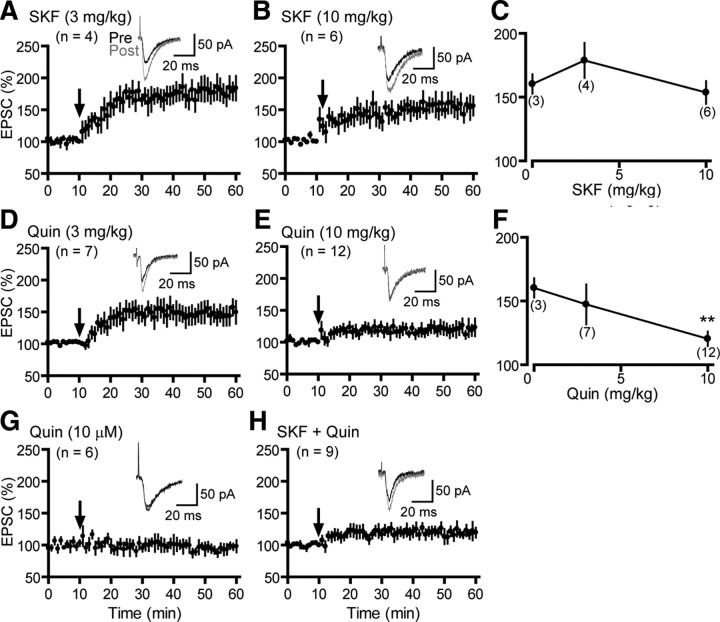
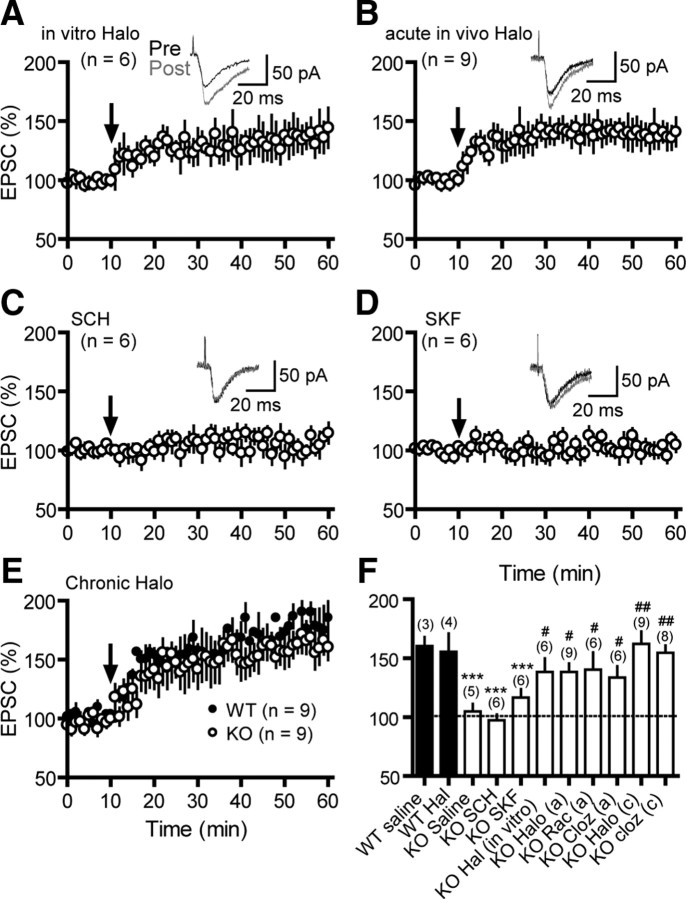
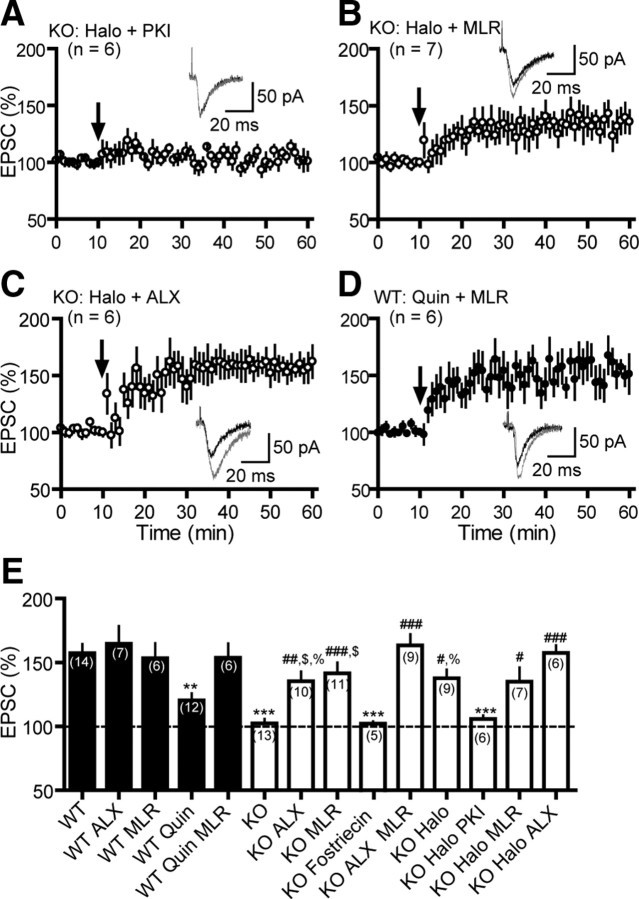
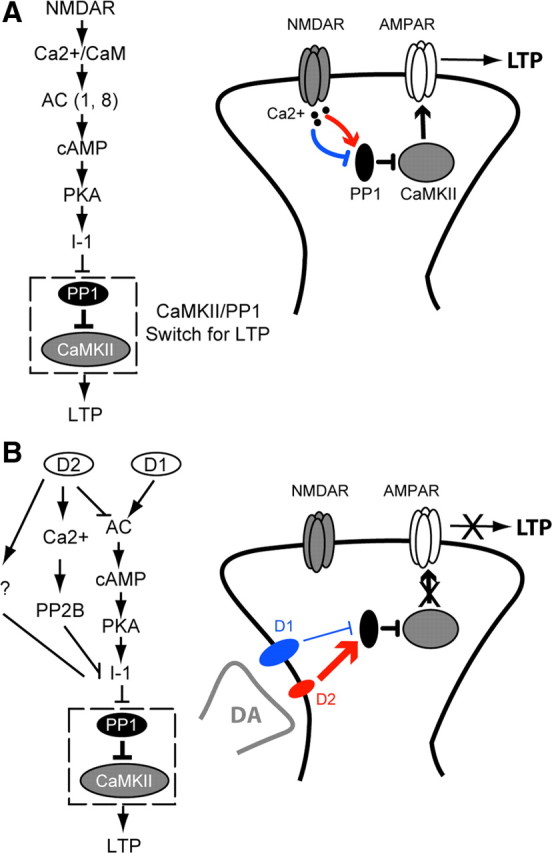
Dopamine (DA) plays crucial roles in the cognitive functioning of the prefrontal cortex (PFC), which, to a large degree, depends on lasting neural traces formed in prefrontal networks. The establishment of these permanent traces requires changes in cortical synaptic efficacy. DA, via the D(1)-class receptors, is thought to gate or facilitate synaptic plasticity in the PFC, with little role recognized for the D(2)-class receptors. Here we show that, when significantly elevated, DA erodes, rather than facilitates, the induction of long-term potentiation (LTP) in the PFC by acting at the far less abundant cortical D(2)-class receptors through a dominant coupling to the protein phosphatase 1 (PP1) activity in postsynaptic neurons. In mice with persistently elevated extracellular DA, resulting from inactivation of the DA transporter (DAT) gene, LTP in layer V PFC pyramidal neurons cannot be established, regardless of induction protocols. Acute increase of dopaminergic transmission by DAT blockers or overstimulation of D(2) receptors in normal mice have similar LTP shutoff effects. LTP in mutant mice can be rescued by a single in vivo administration of D(2)-class antagonists. Suppression of postsynaptic PP1 mimics and occludes the D(2)-mediated rescue of LTP in mutant mice and prevents the acute erosion of LTP by D(2) agonists in normal mice. Our studies reveal a mechanistically unique heterosynaptic PP1 gate that is constitutively driven by background DA to influence LTP induction. By blocking prefrontal synaptic plasticity, excessive DA may prevent storage of lasting memory traces in PFC networks and impair executive functions.


Figures

Figure 1.
Figure 1.
LTP is abolished in mPFC neurons in DAT KO mice. A, Schematic of stimulation and recording configuration from a coronal PFC slice. Cg, Cingulated cortex. B, Characteristic adaptive firing patterns recorded under the current-clamp configuration from a layer V pyramidal neuron. C–E, LTP was induced in a WT (C), but not a KO (D), neuron by the TBS protocol (indicated by arrows) and the summary of normalized LTP (E). F–H, LTP induced in a WT (F), but not a KO (G), neuron by the tetanus protocol (arrows) and the summary data for the normalized LTP (H). I–K, LTP induced in a WT (I), but not a KO (J), neuron by the pairing protocol (arrows) and the summary data for the normalized LTP (K). Traces (insets) are averages of five EPSCs recorded 5 min before and 30 min after the respective induction procedures. For this and following figures, values in parentheses indicate numbers of cells examined except noted otherwise.
Figure 2.
Figure 2.
Elevation of extracellular DA levels impairs LTP in the PFC. A, Schematic showing localization of the in vivo microdialysis probe (red rectangular) in the PFC. CPu, Caudate–putamen; AcbSh, accumbens nucleus shell; M2, secondary motor cortex. B, Extracellular DA levels in the PFC of freely moving mice measured using quantitative low perfusion rate microdialysis. C–E, LTP induced on slices prepared from WT mice that received single injections of saline (C), amphetamine (10 mg/kg, i.p.; Amph; D), or GBR12909 (10 mg/kg, i.p.; GBR; E). F, Summary of effects of in vivo dopaminergic manipulations on prefrontal LTP. LTP was induced by the TBS protocol (arrows). Insets show representative EPSCs recorded before and after LTP induction. In this and following figures, mice were killed 30 min after drug injection. **p < 0.01 vs WT (B) or saline (F), two-tailed Student's t tests.
Figure 3.
Figure 3.
D2 stimulation inhibits PFC LTP in normal mice. A–C, Lack of effect of SKF81297 (SKF; A, 3 mg/kg; B, 10 mg/kg; C, summary, i.p.) on LTP. Despite the trend, the LTP differences between 0, 3, and 10 mg/kg SKF81297 were not statistically significant (Student's t tests). D–F, Dose-dependent blockade of LTP by quinpirole (Quin; D, 3 mg/kg; E, 10 mg/kg; F, summary, i.p.). **p < 0.01 vs saline, two-tailed Student's t tests. G, Effect of quinpirole (10 μm) on LTP in vitro. H, Effect of coinjections of SKF81297 (3 mg/kg) and quinpirole (10 mg/kg) on LTP. Arrows indicate LTP induction by TBS. Insets show representative EPSCs recorded before and after LTP induction.
Figure 4.
Figure 4.
Rescue of prefrontal LTP by blockade of D2 receptors in DAT KO mice in vitro and in vivo. A, Bath application of haloperidol (Halo; 10 μm) enabled LTP in KO slices. B, LTP induced on slices prepared from KO mice that received single acute injection of haloperidol (1 mg/kg, i.p.). C, D, Lack of effect of SCH23390 (0.01 mg/kg, s.c.; SCH; C) or SKF81297 (3 mg/kg, i.p.; SKF; D) on LTP in KO mice. E, LTP induced on slices obtained from WT and KO mice treated daily with haloperidol (0.5 mg/kg, i.p.) for 14 d. Mice were killed 30 min after the last injection. F, Summary of LTP under different conditions. Arrows indicate LTP induction by TBS. Insets are representative EPSCs recorded before and after LTP induction. The dashed line in F indicates the baseline synaptic response. ***p < 0.001 vs WT saline; #p < 0.05, ##p < 0.01 vs KO saline, one-way ANOVA followed by Tukey–Kramer tests. Rac, Raclopride; Cloz, clozapine.
Figure 5.
Figure 5.
Altered synaptic transmission in the PFC of DAT KO and amphetamine-treated mice. A, NMDA/AMPA ratio determined based on the differential kinetics of EPSCNMDA and EPSCAMPA. Top, Sample EPSCs recorded at holding potentials of −60 (to record EPSCAMPA) and +40 mV (to record both EPSCAMPA and EPSCNMDA) from slices prepared from WT, KO, and amphetamine (AMPH; 10 mg/kg, i.p.)-treated WT mice. Bottom, summary of mean NMDA/AMPA ratios. NMDA/AMPA ratio is defined as the amplitude of the NMDAR component 80 ms after stimulation at +40 mV (○) divided by the peak AMPAR component at −60 mV (●). B, NMDA/AMPA ratio determined based on pharmacologically isolated EPSCNMDA and EPSCAMPA. Top, Examples of total EPSC, EPSCAMPA, and EPSCNMDA recorded from a WT and a KO neuron. Bottom, Summary of mean NMDA/AMPA ratios. C, Sample mEPSCs recordings. D, E, Cumulative probabilities of amplitude (D) and interevent interval (E) distributions of mEPSCs. Insets, Mean amplitudes and frequencies. F, Sample mEPSCs recorded at −60 mV in the absence and presence of Mg2+. G, Summary of charge transfer mediated through mEPSCNMDA. mEPSCNMDA was derived by subtracting the average mEPSCAMPA from the average mEPSC, and the area under the resultant average mEPSCNMDA was measured as the charge transfer. ##p < 0.01, Kolmogorov–Smirnov tests vs WT. **p < 0.01; ***p < 0.001 vs WT, two-tailed Student's t tests.
Figure 6.
Figure 6.
Increased paired-pulse facilitation in DAT KO and amphetamine-treated WT mice. A, Representative recordings of PPR at the interpulse interval of 35 ms from slices prepared from WT, KO, and amphetamine (AMPH; 10 mg/kg, i.p.)-treated WT mice. B, Summary of mean PPR at various interpulse intervals. *p < 0.05; **p < 0.01 vs corresponding WT values (t tests).
Figure 7.
Figure 7.
Reduced surface NMDAR receptors in DAT KO mice as analyzed by surface biotinylation. Sample blots (A) and densitometric summary (B) show significantly reduced surface NR1 and NR2A subunit levels in DAT KO mice. Surface NR2B level was also lower in KO mice, but the decrease did not reach a significance level. Total levels of NR1, NR2A, and NR2B were similar between WT and mutant mice, consistent with the results obtained from the total homogenates in the absence of biotinylation (supplemental Fig. S4A,B, available at www.jneurosci.org as supplemental material). Note the absence of actin bands from the surface samples (A, bottom), confirming the validity of the approach. The same amount of protein was loaded per lane. *p < 0.05, Student's t test. Numbers of mice analyzed were indicated in parentheses. Results are presented in arbitrary units normalized to corresponding protein levels observed in WT mice.
Figure 8.
Figure 8.
Normalizing NMDARs or inhibiting postsynaptic PP1 independently rescues prefrontal LTP in DAT KO mice. A, Effects, or lack thereof, bath-applied ALX5407 (ALX; 1 μm) or in vivo injected haloperidol (Halo; 1 mg/kg, i.p.) on representative EPSCs recorded at −60 or +40 mV. Cont, Control. B, Mean NMDA/AMPA ratios determined using the kinetics-based method. **p < 0.01, two-tailed Student's t tests; n.s., not significant. C, Lack of effect of ALX5407 (1 μm) on EPSCAMPA in WT slices. D, Bath application of ALX5407 (1 μm) rescued LTP in KO slices. E, Loading cells with microcystin LR (MLR; 10 μm) rescued LTP in KO neurons. F, G, Loading MLR postsynaptically had no effect on basal EPSCAMPA (F) or EPSCNMDA (G) in KO neurons. H, Loading fostriecin (100 nm) in postsynaptic cells failed to rescue LTP in KO neurons. I, Bath application of ALX5407 (1 μm) further enhanced MLR-rescued LTP in KO neurons. Arrows indicate LTP induction by TBS. Insets show example EPSCs recorded before and after LTP induction (D, E, H, I) or drug application (C) or 5 and 35 min after the establishment of whole-cell configuration (F, G). Data presented in D, E, H, and I are also summarized in Figure 9E.
Figure 9.
Figure 9.
Rescue of prefrontal LTP by D2 blockage depends on postsynaptic PP1 signaling but not NMDAR modulation. A, Postsynaptic loading of PKI(6–22) amide (PKI; 20 μm) blocked haloperidol (Halo)-rescued LTP. B, Loading postsynaptic neurons with microcystin LR (MLR; 10 μm) did not further enhance haloperidol-rescued LTP in KO neurons. C, LTP induced from slices prepared from haloperidol (1 mg/kg, i.p.)-treated DAT KO mice in the presence of ALX5407 (ALX; 1 μm) in the bath. D, Loading cells with MLR (10 μm) prevented the quinpirole (Quin; 10 mg/kg, i.p.) blockade of LTP. E, Summary of LTP under various conditions. Dashed line indicates the baseline synaptic response. Arrows indicate TBS stimulation. Insets show representative EPSCs recorded before and after LTP induction. **p < 0.01, ***p < 0.001 vs WT; #p < 0.05, ##p < 0.01, ###p < 0.001 vs KO; $p < 0.05 vs ALX + MLR (KO); %p < 0.05 vs Halo + ALX (KO); one-way ANOVA with post hoc Tukey–Kramer tests.
Figure 10.
Figure 10.
Working models for homosynaptic versus heterosynaptic gating of LTP in postsynaptic neurons. A, NMDAR-operated homosynaptic gating model (Blitzer et al., 1995). Left, Key components of the LTP gating pathway. During LTP induction, Ca2+ enters through NMDARs and binds to CaM, resulting in the activation of CaM-stimulated adenylyl cyclases [AC (1 and 8)]. Adenylyl cyclases stimulate the production of cAMP, which in turn activates PKA. PKA then phosphorylates I-1 to reduce the activity of PP1, which regulates the phosphorylation of CaMKII. Right, This gating (blue) occurs transiently during LTP induction within the activated synapse, is most effective to permit LTP induced by certain patterns of synaptic stimulation that activate protein phosphatases (red arrow), and represents an activity-dependent homosynaptic gate for LTP. B, DA receptor-operated heterosynaptic gating model (this study). Left, Schematic of intracellular DA signaling pathways and their coupling to the CaMKII/PP1 switch for LTP induction. DA stimulates D2 receptors and elevates postsynaptic PP1 activity, presumably through inhibition of the cAMP/PKA-dependent signaling, activation of the Ca2+-dependent PP2B/calcineurin signaling, other unidentified pathways (?), or combinations of the above. Excessive activation of PP1 may lock CaMKII at a stable, dephosphorylated state refractory to activation by NMDARs during LTP induction (Lisman and Zhabotinsky, 2001). Stimulation of D1-class receptors can, in principle, activate the cAMP/PKA pathway and suppress PP1 activity. This heterosynaptic gating may occur at a dendritic spine harboring D1 and D2 DA receptors and receiving dopaminergic input (right). Although significantly less represented in spines, D2 receptors dominate spine D1 receptors in the regulation of PP1 activity under hyperdopaminergic conditions. This scheme provides a powerful, constitutive control of LTP by background DA tone and may influence LTP regardless of induction protocols. We note that these models represent simplified schemes, because other intracellular signaling processes in postsynaptic neurons, impairments to NMDARs, and presynaptic mechanisms may also contribute to hyperdopaminergic impairments of LTP.

Similar articles

Cited by

References

    1. Amara SG, Kuhar MJ. Neurotransmitter transporters: recent progress. Annu Rev Neurosci. 1993;16:73–93. - PubMed
    1. Arnsten AF. Stimulants: therapeutic actions in ADHD. Neuropsychopharmacology. 2006;31:2376–2383. - PubMed
    1. Arnsten AF. Stress signalling pathways that impair prefrontal cortex structure and function. Nat Rev Neurosci. 2009;10:410–422. - PMC - PubMed
    1. Atkinson BN, Bell SC, De Vivo M, Kowalski LR, Lechner SM, Ognyanov VI, Tham CS, Tsai C, Jia J, Ashton D, Klitenick MA. ALX 5407: a potent, selective inhibitor of the hGlyT1 glycine transporter. Mol Pharmacol. 2001;60:1414–1420. - PubMed
    1. Belmeguenai A, Hansel C. A role for protein phosphatases 1, 2A, and 2B in cerebellar long-term potentiation. J Neurosci. 2005;25:10768–10772. - PMC - PubMed

Publication types

MeSH terms

Substances