. 2009 Dec;119(12):3692-702.
doi: 10.1172/JCI39716. Epub 2009 Nov 9.

NSAIDs prevent, but do not reverse, neuronal cell cycle reentry in a mouse model of Alzheimer disease

Affiliations

NSAIDs prevent, but do not reverse, neuronal cell cycle reentry in a mouse model of Alzheimer disease

Nicholas H Varvel et al. J Clin Invest. 2009 Dec.

Abstract

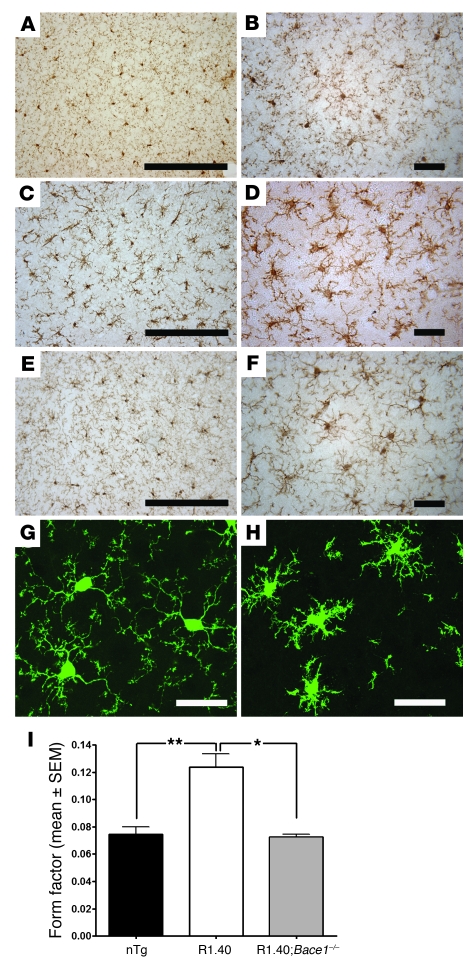
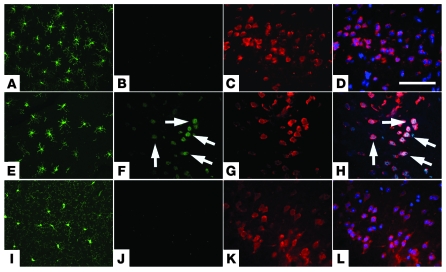
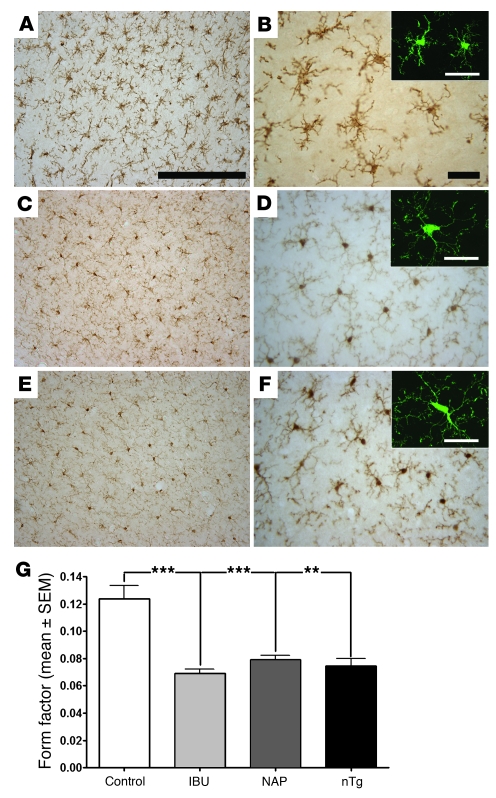
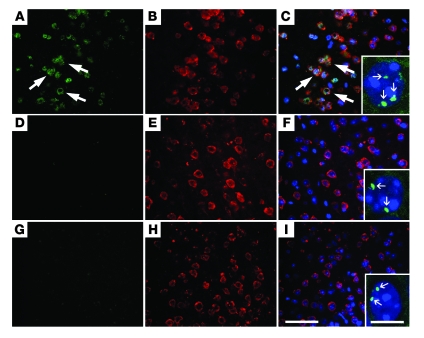
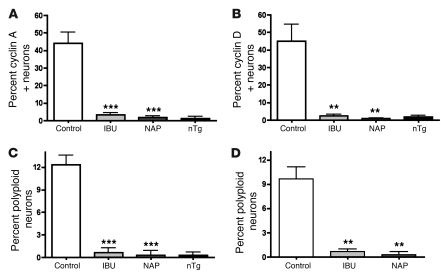
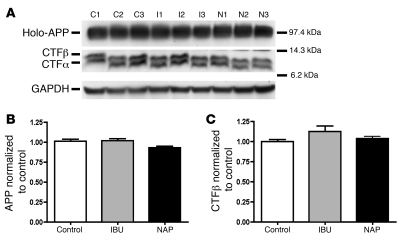
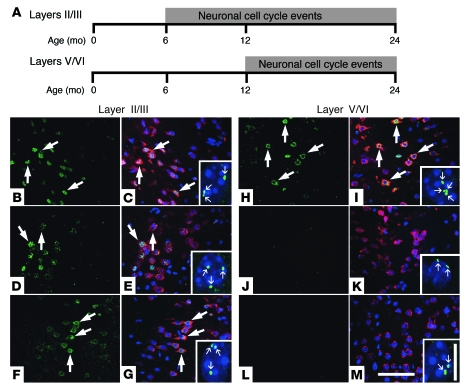
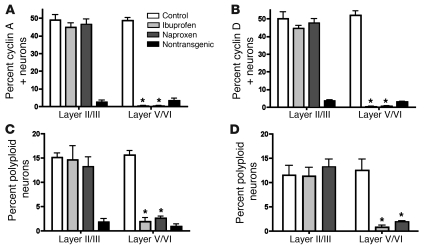
Ectopic cell cycle events (CCEs) mark vulnerable neuronal populations in human Alzheimer disease (AD) and are observed early in disease progression. In transgenic mouse models of AD, CCEs are found before the onset of beta-amyloid peptide (Abeta) deposition to form senile plaques, a hallmark of AD. Here, we have demonstrated that alterations in brain microglia occur coincidently with the appearance of CCEs in the R1.40 transgenic mouse model of AD. Furthermore, promotion of inflammation with LPS at young ages in R1.40 mice induced the early appearance of neuronal CCEs, whereas treatment with 2 different nonsteroidal antiinflammatory drugs (NSAIDs) blocked neuronal CCEs and alterations in brain microglia without altering amyloid precursor protein (APP) processing and steady-state Abeta levels. In addition, NSAID treatment of older R1.40 animals prevented new neuronal CCEs, although it failed to reverse existing ones. Retrospective human epidemiological studies have identified long-term use of NSAIDs as protective against AD. Prospective clinical trials, however, have failed to demonstrate a similar benefit. Our use of CCEs as an outcome measure offers fresh insight into this discrepancy and provides important information for future clinical trials, as it suggests that NSAID use in human AD may need to be initiated as early as possible to prevent disease progression.


Figures

Figure 1
Figure 1. Aβ-dependent alterations in brain microglia in R1.40 transgenic mice.
(A and B) Neocortical microglia in 6-month-old nontransgenic mice exhibited extensive fine processes with small cell bodies. (C and D) Age-matched R1.40 animals exhibited reactive neocortical microglia: thick, asymmetrically oriented processes surrounding a swollen cell body. (E and F) R1.40;Bace1–/– animals at 6 months of age exhibited microglia with a resting morphology that was indistinguishable from that of nontransgenic controls (A and B). (G and H) Cx3cr1+/gfp mice lacking the R1.40 transgene (G) displayed GFP-expressing microglia morphologically similar to the Iba1-stained microglia observed in nontransgenic controls (A and B). Conversely, Cx3cr1+/gfp mice transgenic mice with the R1.40 transgene (H) exhibited microglia with a reactive morphology similar to that of 6-month-old R1.40 transgenic mice (C and D). (I) Morphometric analysis of Iba1-positive microglia revealed significantly higher FF values in R1.40 animals than in nontransgenic (nTg) and R1.40;Bace1–/– mice. *P < 0.01; **P < 0.0004. Scale bars: 500 μm (A, C, and E); 100 μm (B, D, F, G, and H).
Figure 2
Figure 2. LPS administration provokes neuroinflammation and neuronal CCEs.
(AD) Nontransgenic mice at 2 months of age subject to LPS injections exhibited Iba1-immunoreactive neocortical microglia with an activated morphology (A) with no evidence of expression of cyclin D (B) in NeuN-positive neurons (C). (EH) Age-matched R1.40 transgenic animals injected with LPS exhibited Iba1-positive microglia with an activated morphology (E) as well as expression of cyclin D (F) in a subset of NeuN-positive cortical layer II/III neurons (G). (IK) Age-matched R1.40 animals injected with PBS exhibited Iba1-positive microglia with a resting morphology (I) and no evidence of expression of cyclin D (J) in NeuN-positive neurons (K). Similar results were obtained with immunohistochemistry for the cell cycle protein cyclin A (not shown). (D, H, and L) Merged images. Nuclei were counterstained with DAPI (blue). Arrows indicate cyclin D–positive neurons. Scale bar: 100 μm.
Figure 3
Figure 3. Prevention trial of NSAIDs inhibits microglial alterations.
(A and B) R1.40 transgenic mice placed on a control diet for 3 months beginning at 3 months of age exhibited Iba1-immunoreactive neocortical microglia with an activated phenotype, similar to R1.40 animals at 6 months of age (see Figure 1, C and D). (CF) R1.40 animals placed on a 3-month ibuprofen- (C and D) or naproxen-containing (E and F) diet exhibited Iba1-positive microglia with a resting phenotype resembling that of 6-month-old nontransgenic control and R1.40;Bace1–/– animals (see Figure 1, A, B, E, and F). Insets show representative confocal images of Iba1-positive microglia stained with fluorescently tagged secondary antibodies. (G) Morphometric analysis of Iba1-positive microglia revealed significantly lower FF values in mice treated with ibuprofen (IBU) and naproxen (NAP), compared with R1.40 animals fed a control diet, that were not different from the FF values in nontransgenic mice. **P < 0.0004; ***P < 0.0002. Scale bars: 500 μm (A, C, and E); 100 μm (B, D, F, and insets).
Figure 4
Figure 4. Prevention trial of NSAIDs inhibits neuronal CCEs.
(AC) R1.40 transgenic mice placed on a control diet for 3 months beginning at 3 months of age exhibited expression of cyclin A (A) in numerous NeuN-positive (B) neurons on the frontal cortex layers II/III, similar to previously published results (30). Large arrows indicate cyclin A–positive neurons. (DI) R1.40 animals placed on the 3-month ibuprofen- (DF) or naproxen-containing (GI) diet exhibited expression of cyclin A (D and G) in a subset of NeuN-positive (E and H) neurons. Similar results were obtained with immunohistochemistry for the cell cycle protein cyclin D (not shown). (C, F and I) Merged images. Nuclei were counterstained with DAPI (blue). FISH with a DNA probe to mouse chromosome 13 demonstrated a subset of neurons with 3 or 4 spots of hybridization in R1.40 animals fed the control diet (C, inset), while the ibuprofen and naproxen treatment groups exhibited only 2 spots of hybridization (F and I, insets). Small arrows indicate FISH signals in the neuronal nucleus. Scale bars: 100 μm (AI); 10 μm (insets).
Figure 5
Figure 5. Quantification of inhibition of neuronal CCEs in prevention trial of NSAIDs.
Percentages of NeuN-positive neurons in cortical layers II/III exhibiting expression of cyclin A (A) or cyclin D (B) as well as 3 or 4 spots of hybridization with FISH for DNA probes from mouse chromosome 16 (C) and 13 (D) was calculated in R1.40 transgenic mice fed control, ibuprofen-containing, and naproxen-containing diets as well as in nontransgenic mice fed the control diet (n = 5). **P < 0.003, ***P < 0.001 versus control diet–fed R1.40 transgenic mice.
Figure 6
Figure 6. Lack of effect of chronic NSAID treatments on APP processing.
(A) Western blots of brain extracts from the R1.40 animals fed control (C1–C3), ibuprofen-containing (I1–I3), and naproxen-containing (N1–N3) diets were probed with antibodies to the C terminus of APP and subsequently stripped and reprobed with an antibody against GAPDH as a loading control. Shown on the right is the approximate size in kDa. (B and C) Relative levels of holo-APP (B) and CTFβ (C) were quantified (n = 3) from animals on the control, ibuprofen-containing, and naproxen-containing diets by normalizing the intensity values of APP and APP CTFβ to GAPDH. No significant differences were observed in the relative levels of holo-APP or CTFβ between treatment groups.
Figure 7
Figure 7. Therapeutic trial of NSAIDs inhibits subsequent, but not extant, neuronal CCEs.
(A) Neuronal CCEs were first observed in frontal cortical layers II/III at 6 months of age and persisted for 2 or more years in the R1.40 animals. Neuronal CCEs were not observed in deeper cortical layers V/VI until 12 months of age. (BM) R1.40 transgenic mice at 6 months of age were fed control (B, C, H, and I), ibuprofen-containing (D, E, J, and K) or naproxen-containing (F, G, L, and M) diets for 6 months. (B and H) Control diet–fed mice exhibited expression of cyclin D (large arrows) in NeuN-positive neurons in frontal cortex layers II/III and layers V/VI. (D, F, J, and L) Ibuprofen- or naproxen-containing diet–fed mice exhibited expression of cyclin D in a subset of NeuN-positive neurons in layers II/III (D and F), with minimal expression of cyclin D in layers V/VI (J and L). (C, E, G, I, K, and M) Merged images. Sections were stained with NeuN (red), and nuclei were counterstained with DAPI (blue). FISH analysis with a DNA probe specific for mouse chromosome 16 demonstrated the presence of a subset of neuronal nuclei with 3 or 4 spots of hybridization (small arrows) in all treatment groups in cortical layers II/III (C, E, and G, insets) and only the control diet group in cortical layers V/VI (I, K, and M, insets). Scale bars: 100 μm (BM); 10 μm (insets).
Figure 8
Figure 8. Quantification of inhibition of neuronal CCEs in NSAID therapeutic trial.
Percentages of NeuN-positive neurons in cortical layers II/III and layers V/VI exhibiting expression of cyclin A (A) or cyclin (B) as well as 3 or 4 spots of hybridization with FISH for DNA probes from mouse chromosome 16 (C) and 13 (D) were calculated in R1.40 transgenic mice fed control, ibuprofen-containing, and naproxen-containing diets as well as in nontransgenic mice fed the control diet (n = 5). *P < 0.001 versus control diet–fed R1.40 transgenic mice.

Similar articles

Cited by

References

    1. Alzheimer’s Association. . 2009 Alzheimer’s disease facts and figures. Alzheimers Dement. 2009;5:234–270. doi: 10.1016/j.jalz.2009.03.001. - DOI - PubMed
    1. Akiyama H., et al. Inflammation and Alzheimer’s disease. Neurobiol. Aging. 2000;21:383–421. doi: 10.1016/S0197-4580(00)00124-X. - DOI - PMC - PubMed
    1. Wyss-Coray T. Inflammation in Alzheimer disease: driving force, bystander or beneficial response? Nat. Med. 2006;12:1005–1015. - PubMed
    1. Bolmont T., et al. Dynamics of the microglial/amyloid interaction indicate a role in plaque maintenance. J. Neurosci. 2008;28:4283–4292. doi: 10.1523/JNEUROSCI.4814-07.2008. - DOI - PMC - PubMed
    1. Meyer-Luehmann M., et al. Rapid appearance and local toxicity of amyloid-beta plaques in a mouse model of Alzheimer’s disease. Nature. 2008;451:720–724. doi: 10.1038/nature06616. - DOI - PMC - PubMed

Publication types

MeSH terms