. 2009 Nov 11;4(11):e7761.
doi: 10.1371/journal.pone.0007761.

Origins of an intrinsic hippocampal EEG pattern

Affiliations

Origins of an intrinsic hippocampal EEG pattern

Christopher S Rex et al. PLoS One. .

Abstract

Sharp waves (SPWs) are irregular waves that originate in field CA3 and spread throughout the hippocampus when animals are alert but immobile or as a component of the sleep EEG. The work described here used rat hippocampal slices to investigate the factors that initiate SPWs and govern their frequency. Acute transection of the mossy fibers reduced the amplitude but not the frequency of SPWs, suggesting that activity in the dentate gyrus may enhance, but is not essential for, the CA3 waves. However, selective destruction of the granule cells and mossy fibers by in vivo colchicine injections profoundly depressed SPW frequency. Reducing mossy fiber release with an mGluR2 receptor agonist or enhancing it with forskolin respectively depressed or increased the incidence of SPWs. Collectively, these results indicate that SPWs can be triggered by constitutive release from the mossy fibers. The waves were not followed by large after-hyperpolarizing potentials and their frequency was not strongly affected by blockers of various slow potassium channels. Antagonists of GABA-B mediated IPSCs also had little effect on incidence. It appears from these results that the spacing of SPWs is not dictated by slow potentials. However, modeling work suggests that the frequency and variance of large mEPSCs from the mossy boutons can account for the temporal distribution of the waves. Together, these results indicate that constitutive release from the mossy fiber terminal boutons regulates the incidence of SPWs and their contribution to information processing in hippocampus.


Conflict of interest statement

Competing Interests: The authors have declared that no competing interests exist.

Figures

Figure 1
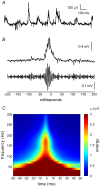
Figure 1. Sharp waves (SPWs) and ripples occur spontaneously in hippocampal slices.
A, Typical recording collected from the pyramidal cell layer of field CA3. B, A single SPW is shown unfiltered (top) and after high-pass filtering (bottom); low voltage, high frequency activity (ripples) occurs on the ascending phase of the SPW and decreases quickly after the peak of the wave (0 ms). C, Time frequency representation of sharp wave/ripples. Energy in the ∼150–200 Hz (‘ripple’) range of the signal is maximal in the 10 ms before the peak of the SPW, which occurs in the figure at 0 ms and is indicated by a vertical dotted line.
Figure 2
Figure 2. Knife cuts through the projections from entorhinal cortex to hippocampus (perforant path) do not affect SPW activity in field CA3.
A, Schematic of a slice from the temporal hippocampus illustrating the location of the knife sections used in the present studies: cut #1 separates the hippocampus from the entorhinal cortex while cut #2 is through the mossy fibers (dark gray) at the entrance to the hilus (m.f: mossy fiber pathway; dg: dentate gyrus). B, Baseline SPWs recorded from CA3 stratum pyramidale (top). Recordings collected at least 30 minutes after severing the perforant path (bottom). C, Mean rate and power (± SEM) of SPWs for a group of five slices prior to and following cuts through the perforant path.
Figure 3
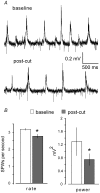
Figure 3. Knife cuts through the connections between the dentate gyrus and field CA3 (mossy fibers) reduce the rate and size of SPWs in the latter region.
A, Spontaneous activity collected from CA3 stratum pyramidale prior to (baseline) and at least 30 minutes after cutting the mossy fibers (post-cut). B, Mean rate and power (± SEM) results for a group of five slices (*p<0.02; n = 5 slices).
Figure 4
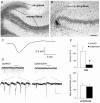
Figure 4. Destruction of the mossy fibers drastically reduces the incidence of SPWs.
A,B , Photomicrographs show Timm's- and Nissl- stained sections through slices from an untreated control rat (A) and an experimental rat (B) that received a local colchicine injection that destroyed the granule cells (stratum granulosum) and mossy fibers while leaving the CA3 pyramidal cells intact (calibration bar  = 150 µm for A and B). C, Average of 11 EPSPs recorded across 4 min from CA3 stratum radiatum in response to stimulation of CA3 commissural-associational system in a representative slice from the colchicine lesion group. D, SPWs recorded from the apical dendrites of field CA3 in slices from control (left) and colchicine-treated (right) rats. Bottom traces show the indicated segment of top traces magnified to scale. Calibration: 50 µV/500 ms for top traces; 100 µV/1.5 sec for bottom traces. E, The rate of spontaneous SPWs (top) was significantly lower in the colchicine group (n = 4 slices) as compared to controls (n = 3, *p<0.05, 2-tailed t-test), but the average amplitude of SPWs was not significantly affected by the colchicine lesion (bottom).
Figure 5
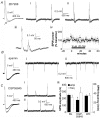
Figure 5. Forskolin increases the frequency of mEPSCs and SPWs.
A, Miniature (m) EPSCs recorded from a CA3 pyramidal neuron prior and during the infusion of 10 µM forskolin. B, SPWs recorded from CA3 stratum radiatum prior to (baseline) and 30 min after (bottom) infusing 10 µM forskolin. C, Group data (n = 5 slices) showing the time course over which forskolin increases the rate of SPW occurrence. D, Forskolin has its greatest effect on power of spontaneous oscillations in the SPW (0.1–7.0 Hz) frequency range.
Figure 6
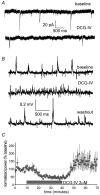
Figure 6. A type 2/3 metabotropic glutamate receptor agonist (DCG-IV) reduces the frequency of mEPSCs and SPWs.
A, mEPSCs collected from field CA3b prior to and after an infusion of DCG-IV (2 µM). B, DCG-IV caused a mark reduction in the frequency of high voltage SPWs and an increase in low voltage, fast activity. These effects reversed upon drug wash-out. C, A 30 min infusion of the agonist caused a rapid and reversible reduction (57%) in EEG power in the SPW frequency range (p<0.001, repeated measures ANOVA; n = 4 slices).
Figure 7
Figure 7. Effects of manipulating after-hyperpolarizing potentials (AHPs) on SPWs.
A, ZD7288 (10 µM), an antagonist of I(h), reduces the AHP (arrow) found immediately after the composite EPSC produced by a brief burst of stimulation pulses, but has little effect on the later component of the AHP in CA3 neurons. Experiment was repeated in 3 cells from 3 slices. (i) SPWs recorded 10 minutes before and (ii) 10 minutes after the infusion of 10 µM ZD7288. Note the presence of a single small potential following each SPW under the latter conditions. (iii) Enlargement of example trace from (ii) indicates that the after-discharges have a similar waveform to SPWs. (iv) Power of the EEG spectrum (% baseline [bl]) in the SPW frequency range is unaffected by ZD7288 (n = 4 slices). B, Apamin (100 nM, 20 min), an inhibitor of SK channels, does not affect the composite EPSC elicited by a brief burst of afferent stimulation (left panel). Effect representative of 3 cells tested. Frequency and size of SPWs collected before (i) and during (ii) 100 nM apamin infusion are comparable. Records were collected from the apical dendrites of field CA3 and illustrate the reversed polarity associated with a local dipole. C, CGP55845 (50 µM, 20 min), an antagonist of GABA-B receptors, reduces the AHP elicited by an intense burst of afferent stimulation (left panel). Effect representative of 4 cells tested. SPWs observed 10 min prior to (i) and during (ii) 50 µM CGP55845 infusion did not show detectable differences in frequency or shape. (iii) The GABA-B antagonist produced a small depression of SPW amplitude (*p<0.05, paired t-test; n = 3) but did not reliably increase the frequency (p>0.3) of the waves. (BL:baseline; WO: washout).
Figure 8
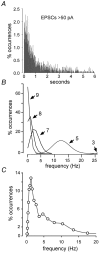
Figure 8. Frequency at which small collections of simulated neurons fire within the same 20 ms time bin in response to inputs arriving at the observed temporal distribution of large mEPSCs.
A, Interval histogram for mEPSCs greater than 50 pA recorded from nine CA3b pyramidal neurons. B, Frequency at which the indicated numbers of neurons (arrow), from a simulation of 500 cells, fire during the same 20 ms time bin. Each cell in the model received the input shown in panel A. C, Frequency distribution of SPWs recorded from field CA3b under baseline conditions.
Figure 9
Figure 9. Minimal stimulation of the mossy fibers triggers CA3 sharp waves.
A, Stimulation pulses (arrows) were delivered to the infragranular zone of the hilus to activate the mossy fibers arising from a small portion of the granule cell population. This reliably triggered a negative-going, complex response in the apical dendrites (str. radiatum) of field CA3b; the size and shape of this response closely resembled those of spontaneous SPWs. High-pass filtered trace (100–400 Hz; time-locked to upper trace) showed that both the evoked response and spontaneous SPWs were accompanied by high frequency activity, particularly on their ascending phases. B, As with SPWs, the complex potentials elicited by mossy fiber stimulation were positive in sign when recorded at the boundary between str. lucidum and str. pyramidale. Note that a small mossy fiber response (asterisk) precedes the positive wave. The downward arrow denotes the stimulation pulse. C, The frequency distribution for the peak amplitude of the evoked waves (EWs) illustrates the highly variable nature of the responses over the course of a recording session. Note the extensive overlap for the evoked and spontaneous wave distributions.

References

    1. Buzsaki G. Theta oscillations in the hippocampus. Neuron. 2002;33:325–340. - PubMed
    1. Vanderwolf CH. Hippocampal electrical activity and voluntary movement in the rat. Electroencephalogr Clin Neurophysiol. 1969;26:407–418. - PubMed
    1. Vertes RP, Hoover WB, Viana Di Prisco G. Theta rhythm of the hippocampus: subcortical control and functional significance. Behav Cogn Neurosci Rev. 2004;3:173–200. - PubMed
    1. Konopacki J, MacIver MB, Bland BH, Roth SH. Carbachol-induced EEG ‘theta’ activity in hippocampal brain slices. Brain Res. 1987;405:196–198. - PubMed
    1. Petsche H, Stumpf C, Gogolak G. The significance of the rabbit's septum as a relay station between the midbrain and the hippocampus. I. The control of hippocampus arousal activity by the septum cells. Electroencephalogr Clin Neurophysiol. 1962;14:202–211. - PubMed

Publication types