. 2010:216-27.
doi: 10.1142/9789814295291_0024.

Predicting RNA structure by multiple template homology modeling

Affiliations

Predicting RNA structure by multiple template homology modeling

Samuel C Flores et al. Pac Symp Biocomput. 2010.

Abstract

Despite the importance of 3D structure to understand the myriad functions of RNAs in cells, most RNA molecules remain out of reach of crystallographic and NMR methods. However, certain structural information such as base pairing and some tertiary contacts can be determined readily for many RNAs by bioinformatics or relatively low cost experiments. Further, because RNA structure is highly modular, it is possible to deduce local 3D structure from the solved structures of evolutionarily related RNAs or even unrelated RNAs that share the same module. RNABuilder is a software package that generates model RNA structures by treating the kinematics and forces at separate, multiple levels of resolution. Kinematically, bonds in bases, certain stretches of residues, and some entire molecules are rigid while other bonds remain flexible. Forces act on the rigid bases and selected individual atoms. Here we use RNABuilder to predict the structure of the 200-nucleotide Azoarcus group I intron by homology modeling against fragments of the distantly-related Twort and Tetrahymena group I introns and by incorporating base pairing forces where necessary. In the absence of any information from the solved Azoarcus intron crystal structure, the model accurately depicts the global topology, secondary and tertiary connections, and gives an overall RMSD value of 4.6 A relative to the crystal structure. The accuracy of the model is even higher in the intron core (RMSD = 3.5 A), whereas deviations are modestly larger for peripheral regions that differ more substantially between the different introns. These results lay the groundwork for using this approach for larger and more diverse group I introns, as well for still larger RNAs and RNA-protein complexes such as group II introns and the ribosomal subunits.


Figures

Figure 1
Figure 1
Potential and force as a function of distance from attachment frame of residue 1 to body frame of residue 2.
Figure 2
Figure 2
The secondary structures of A) the Azoarcus intron, B) the Twort intron, and C) the P4-P6 domain of the Tetrahymena intron. The domains are color-coded, with like colors indicating a correspondence between the Azoarcus model and the Twort or Tetrahymena intron templates. This correspondence was used as the basis for threading. Note that the tetraloop-receptor structure from the interaction of L5b with J6a/6b of the Tetrahymena intron (orange) was used as a template for both tetraloop-receptor contacts within the Azoarcus intron. Regions that were not threaded are shown in black.
Figure 3
Figure 3
Modeling the Azoarcus intron (blue) by threading to fragments of the Twort and Tetrahymena intron structures. Three rigid fragments were used as templates: the nearly-complete intron from Twort (left, yellow) and the tetraloop receptor from the P4-P6 domain of the Tetrahymena intron (top, orange). The fragments corresponding to the Azoarcus intron were initially in extended conformations (bottom). The final model of the threaded Azoarcus intron, superimposed on the Twort and Tetrahymena template fragments, is shown at right.
Figure 4
Figure 4
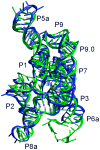
Model of the Azoarcus intron (blue) superimposed on the structure determined by x-ray crystallography (green). Visible helices are labeled (see Fig. 2).
Figure 5
Figure 5
Regions of the Azoarcus intron model (blue) superimposed on the corresponding regions of the crystal structure (green). A) Tetraloop-receptor interaction of L2 and P8. B) P9 and P9.0. Each region is shown in wall-eyed stereoview in the same orientation as Figure 3.

References

    1. Roth A, Breaker RR. Annu Rev Biochem. 2009;78:305–334. - PMC - PubMed
    1. Bartel DP. Cell. 2004;116:281–297. - PubMed
    1. Carthew RW, Sontheimer EJ. Cell. 2009;136:642–655. - PMC - PubMed
    1. Katayama S, et al. Science. 2005;309:1564–1566. - PubMed
    1. Carninci P, et al. Science. 2005;309:1559–1563. - PubMed

Publication types