Comparative Study
. 2009 Nov 12:10:519.
doi: 10.1186/1471-2164-10-519.

Comparison of Affymetrix Gene Array with the Exon Array shows potential application for detection of transcript isoform variation

Affiliations
Comparative Study

Comparison of Affymetrix Gene Array with the Exon Array shows potential application for detection of transcript isoform variation

Kevin Ch Ha et al. BMC Genomics. .

Abstract

Background: The emergence of isoform-sensitive microarrays has helped fuel in-depth studies of the human transcriptome. The Affymetrix GeneChip Human Exon 1.0 ST Array (Exon Array) has been previously shown to be effective in profiling gene expression at the isoform level. More recently, the Affymetrix GeneChip Human Gene 1.0 ST Array (Gene Array) has been released for measuring gene expression and interestingly contains a large subset of probes from the Exon Array. Here, we explore the potential of using Gene Array probes to assess expression variation at the sub-transcript level. Utilizing datasets of the high quality Microarray Quality Control (MAQC) RNA samples previously assayed on the Exon Array and Gene Array, we compare the expression measurements of the two platforms to determine the performance of the Gene Array in detecting isoform variations.

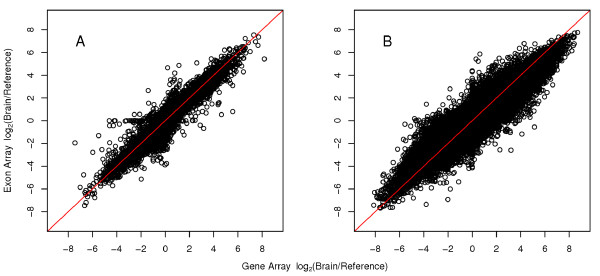
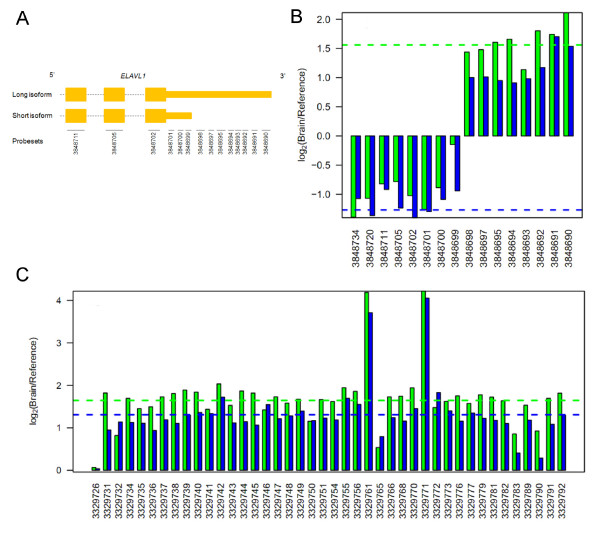
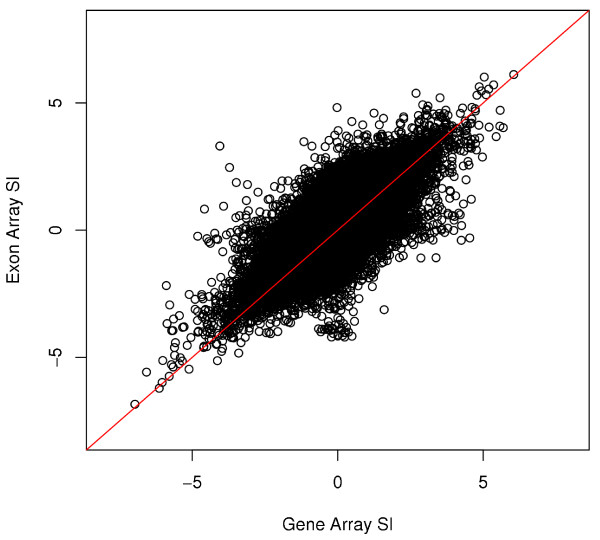
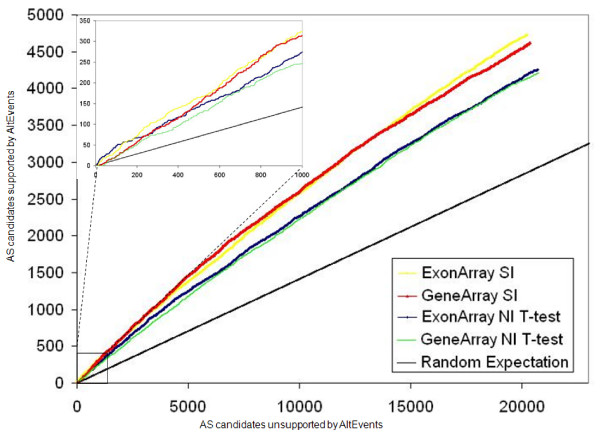
Results: Overall, we show that the Gene Array is comparable to the Exon Array in making gene expression calls. Moreover, to examine expression of different isoforms, we modify the Gene Array probe set definition file to enable summarization of probe intensity values at the exon level and show that the expression profiles between the two platforms are also highly correlated. Next, expression calls of previously known differentially spliced genes were compared and also show concordant results. Splicing index analysis, representing estimates of exon inclusion levels, shows a lower but good correlation between platforms. As the Gene Array contains a significant subset of probes from the Exon Array, we note that, in comparison, the Gene Array overlaps with fewer but still a high proportion of splicing events annotated in the Known Alt Events UCSC track, with abundant coverage of cassette exons. We discuss the ability of the Gene Array to detect alternative splicing and isoform variation and address its limitations.

Conclusion: The Gene Array is an effective expression profiling tool at gene and exon expression level, the latter made possible by probe set annotation modifications. We demonstrate that the Gene Array is capable of detecting alternative splicing and isoform variation. As expected, in comparison to the Exon Array, it is limited by reduced gene content coverage and is not able to detect as wide a range of alternative splicing events. However, for the events that can be monitored by both platforms, we estimate that the selectivity and sensitivity levels are comparable. We hope our findings will shed light on the potential extension of the Gene Array to detect alternative splicing. It should be particularly suitable for researchers primarily interested in gene expression analysis, but who may be willing to look for splicing and isoform differences within their dataset. However, we do not suggest it to be an equivalent substitute to the more comprehensive Exon Array.


Figures

Figure 1
Figure 1
Comparison of fold changes detected between the Gene Array and Exon Array. Fold changes (log2 transformed) detected by the two platforms are highly correlated at both the (A) gene level (R = 0.94) and (B) exon level (R = 0.91). A background filtering and correction step was applied using an expression cutoff of 30. The red line indicates the x-y diagonal.
Figure 2
Figure 2
Comparison of Gene Array and Exon Array expression of isoform variants between brain and reference tissues. (A) Schematic of the 3' end of the long and short isoform of ELAVL1, illustrating an alternative polyadenylation site at the UTR. Exons are indicated in orange, introns as dashed lines, and exon probe sets as solid lines. (B) Expression profile of ELAVL1 as measured by both platforms (Gene Array in green, Exon Array in blue), confirming the two isoforms. Exon level log2 fold changes are indicated by the vertical bars and summarized by each exon probe set within the gene as indicated on the horizontal axis in 5' to 3' direction. Gene level log2 fold changes are indicated by horizontal dashed lines across the gene and coloured accordingly to correspond to each platform. Note the discrepancy in estimating gene expression fold changes for ELAVL1. (C) Similarly, an expression profile of MADD, illustrating cassette exons at 3329761, 3329771, and 3329783.
Figure 3
Figure 3
Comparison of SI values between the Gene Array and Exon Array. After applying background filtering and correction with a cutoff of 30, the SI values between the two platforms were reasonably correlated (R = 0.61), suggesting that the Gene Array has a potential to detect alternative splicing and isoform variation genome-wide. The red line indicates the x-y diagonal.
Figure 4
Figure 4
Agreement with Alt Events for each platform. This plot illustrates the comparison between the Gene Array and Exon Array in detecting known splicing events (based on the Alt Events UCSC track) as determined using SI and t-statistic on NI. Lines are colour-coded according to the figure key. The subplot provides a zoomed-in view of the top 1,000 candidates detected by both metrics. For both metrics, we note that the observed agreement well exceeds random expectation.
Figure 5
Figure 5
Variability of detected splicing events across platforms. The Gene Array and Exon Array show a modest amount of overlap of detected splicing events as measured using SI (blue) and t-test (red). However, both metrics perform visibly better than what is expected by random chance (black). As the total number of exons being considered increases, the overlap reaches saturation. The subplot provides a zoomed-in view of the top 5,000 candidates detected by both metrics. The dashed black line represents the x-y diagonal. Again, it should be noted that the lists produced using the fold-change method are more stable across platforms than the lists produced using the t-test.

Similar articles

Cited by

References

    1. Blencowe BJ. Alternative splicing: new insights from global analyses. Cell. 2006;126(1):37–47. doi: 10.1016/j.cell.2006.06.023. - DOI - PubMed
    1. Wang GS, Cooper TA. Splicing in disease: disruption of the splicing code and the decoding machinery. Nat Rev Genet. 2007;8(10):749–761. doi: 10.1038/nrg2164. - DOI - PubMed
    1. Kim E, Goren A, Ast G. Insights into the connection between cancer and alternative splicing. Trends Genet. 2008;24(1):7–10. doi: 10.1016/j.tig.2007.10.001. - DOI - PubMed
    1. Lee C, Roy M. Analysis of alternative splicing with microarrays: successes and challenges. Genome Biol. 2004;5(7):231. doi: 10.1186/gb-2004-5-7-231. - DOI - PMC - PubMed
    1. Moore MJ, Silver PA. Global analysis of mRNA splicing. RNA. 2008;14(2):197–203. doi: 10.1261/rna.868008. - DOI - PMC - PubMed

Publication types

MeSH terms