Time-frequency analysis of movement-related spectral power in EEG during repetitive movements: a comparison of methods
- PMID: 19909774
- PMCID: PMC2815165
- DOI: 10.1016/j.jneumeth.2009.10.022
Time-frequency analysis of movement-related spectral power in EEG during repetitive movements: a comparison of methods
Abstract
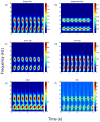
During dynamic voluntary movements, power in the alpha- and beta-bands resulting from synchronized neuronal activity is modulated in a manner that is time-locked to movement onset. These signals can be readily recorded from the scalp surface using electroencephalography. Abnormalities in the magnitude and timing of these oscillations are present in a wide variety of movement disorders including Parkinson's disease and dystonia. Most studies have examined movement-related oscillations in the context of single discrete movements, yet marked impairments are often seen during the performance of repetitive movements. For this reason, there is considerable need for analysis methods that can resolve the modulation of these oscillations in both the frequency and time domains. Presently, there is little consensus on which is the most appropriate method for this purpose. In this paper, a comparison of commonly used time-frequency methods is presented for the analysis of movement-related power in the alpha- and beta-bands during repetitive movements. The same principles hold, however, for any form of repetitive or rhythmic input-output processes in the brain. In particular, methods based on band-pass filtering, the short-time Fourier transform (STFT), continuous wavelet transform and reduced interference distributions are discussed. The relative merits and limitations in terms of spectral or temporal resolution of each method are shown with the use of simulated and experimental data. It is shown that the STFT provides the best compromise between spectral and temporal resolution and thus is the most appropriate approach for the analysis and interpretation of repetitive movement-related oscillations in health and disease.
(c) 2009 Elsevier B.V. All rights reserved.
Figures


References
-
- Alegre M, Labarga A, Gurtubay IG, Iriarte J, Malanda A, Artieda J. Beta electroencephalograph changes during passive movements: sensory afferences contribute to beta event-related desynchronization in humans. Neuroscience Letters. 2002;331:29–32. - PubMed
-
- Arnold M, Miltner WHR, Witte H, Bauer R, Braun C. Adaptive AR modeling of nonstationary time series by means of Kalman filtering. IEEE Transactions on Biomedical Engineering. 1998;45:553–62. - PubMed
-
- Baker SN, Kilner JM, Pinches EM, Lemon RN. The role of synchrony and oscillations in the motor output. Experimental Brain Research. 1999;128:109–17. - PubMed
-
- Bendat JS, Piersol AG. Random Data: Analysis and Measurement Procedures. 3. John Wiley & Sons, Inc; New York, NY: 2000.
-
- Bohlin T. Analysis of EEG Signals with Changing Spectra Using a Short-Word Kalman Estimator. Mathematical Biosciences. 1977;35:221–59.
Publication types
MeSH terms
Grants and funding
LinkOut - more resources
Full Text Sources
Other Literature Sources

