

Evaluation of candidate genes in a genome-wide association study of childhood asthma in Mexicans
- PMID: 19910030
- PMCID: PMC2823974
- DOI: 10.1016/j.jaci.2009.09.007
Evaluation of candidate genes in a genome-wide association study of childhood asthma in Mexicans
Abstract
Background: More than 200 asthma candidate genes have been examined in human association studies or identified with knockout mouse approaches. However, many have not been systematically replicated in human populations, especially those containing a large number of tagging single nucleotide polymorphisms (SNPs).
Objective: We comprehensively evaluated the association of previously implicated asthma candidate genes with childhood asthma in a Mexico City population.
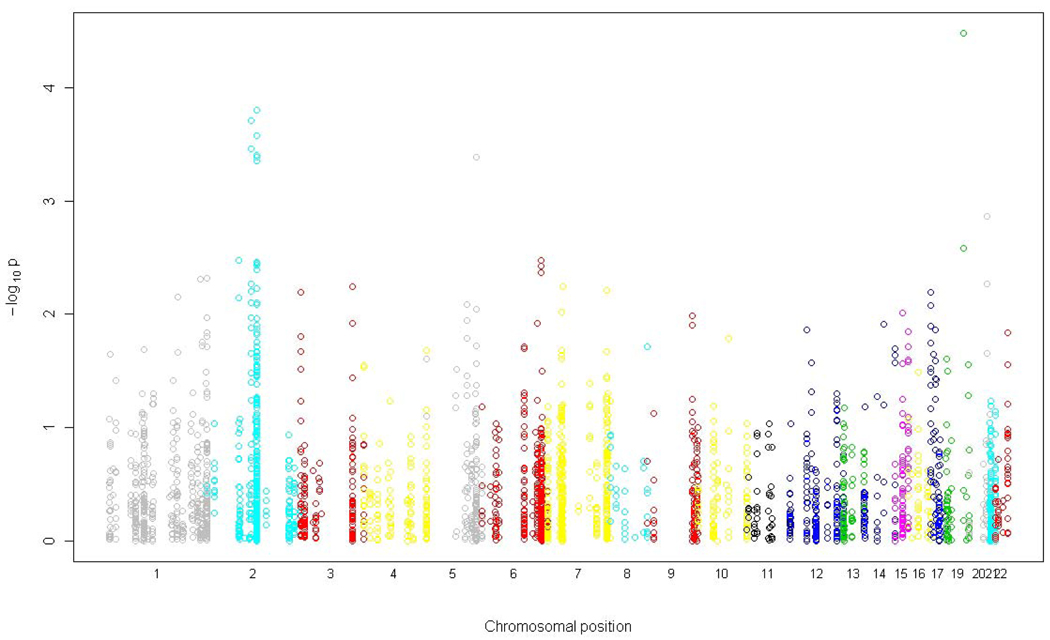
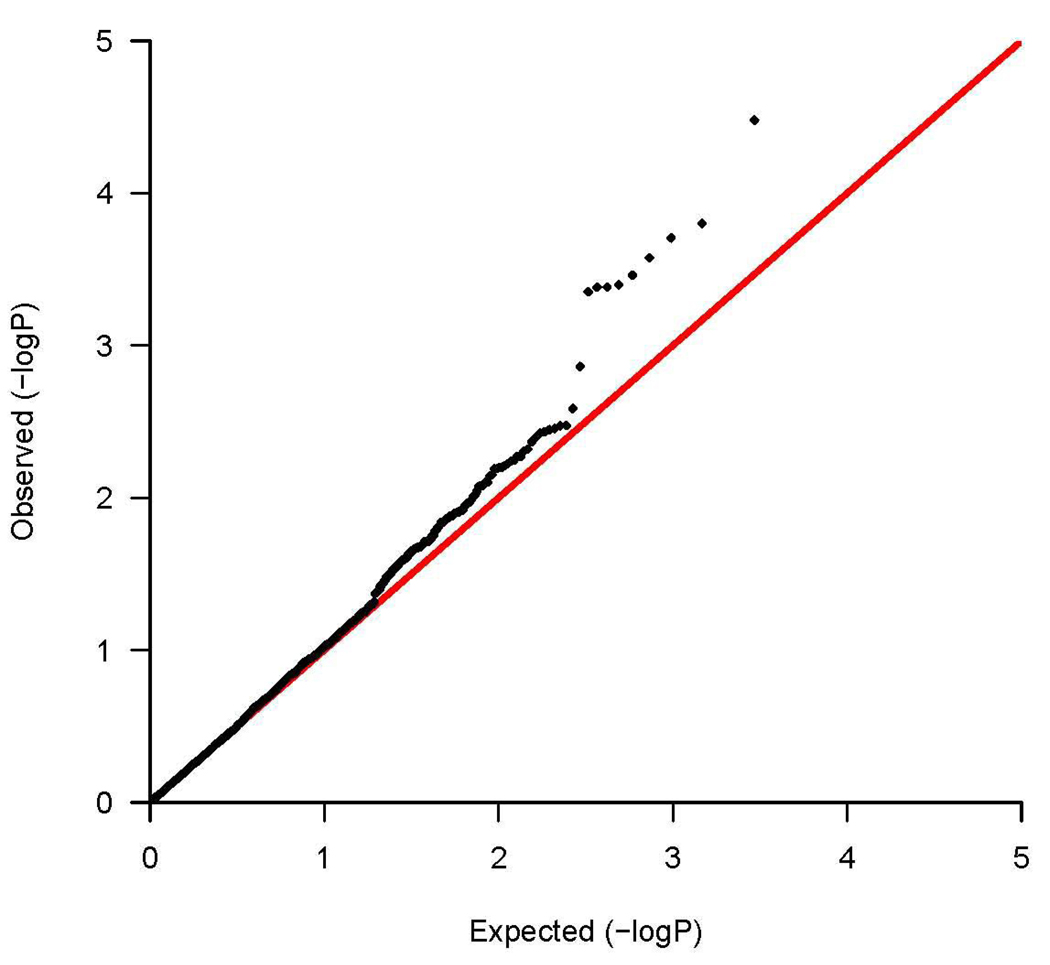
Methods: From the literature, we identified candidate genes with at least 1 positive report of association with asthma phenotypes in human subjects or implicated in asthma pathogenesis using knockout mouse experiments. We performed a genome-wide association study in 492 asthmatic children aged 5 to 17 years and both parents using the Illumina HumanHap 550v3 BeadChip. Separate candidate gene analyses were performed for 2933 autosomal SNPs in the 237 selected genes by using the log-linear method with a log-additive risk model.
Results: Sixty-one of the 237 genes had at least 1 SNP with a P value of less than .05 for association with asthma. The 9 most significant results were observed for rs2241715 in the gene encoding TGF-beta1 (TGFB1; P = 3.3 x 10(-5)), rs13431828 and rs1041973 in the gene encoding IL-1 receptor-like 1 (IL1RL1; P = 2 x 10(-4) and 3.5 x 10(-4)), 5 SNPs in the gene encoding dipeptidyl-peptidase 10 (DPP10; P = 1.6 x 10(-4) to 4.5 x 10(-4)), and rs17599222 in the gene encoding cytoplasmic FMR1 interacting protein 2 (CYFIP2; P = 4.1 x 10(-4)). False discovery rates were less than 0.1 for all 9 SNPs. Multimarker analysis identified TGFB1, IL1RL1, the gene encoding IL-18 receptor 1 (IL18R1), and DPP10 as the genes most significantly associated with asthma.
Conclusions: This comprehensive analysis of literature-based candidate genes suggests that SNPs in several candidate genes, including TGFB1, IL1RL1, IL18R1, and DPP10, might contribute to childhood asthma susceptibility in a Mexican population.
Copyright 2010 American Academy of Allergy, Asthma & Immunology. Published by Mosby, Inc. All rights reserved.
Conflict of interest statement
Figures
Similar articles
-
Association of IL33-IL-1 receptor-like 1 (IL1RL1) pathway polymorphisms with wheezing phenotypes and asthma in childhood.J Allergy Clin Immunol. 2014 Jul;134(1):170-7. doi: 10.1016/j.jaci.2013.12.1080. Epub 2014 Feb 22. J Allergy Clin Immunol. 2014. PMID: 24568840
-
Genome-wide association study implicates chromosome 9q21.31 as a susceptibility locus for asthma in mexican children.PLoS Genet. 2009 Aug;5(8):e1000623. doi: 10.1371/journal.pgen.1000623. Epub 2009 Aug 28. PLoS Genet. 2009. PMID: 19714205 Free PMC article.
-
Analyses of shared genetic factors between asthma and obesity in children.J Allergy Clin Immunol. 2010 Sep;126(3):631-7.e1-8. doi: 10.1016/j.jaci.2010.06.030. J Allergy Clin Immunol. 2010. PMID: 20816195 Free PMC article.
-
Genome-wide association studies for discovery of genes involved in asthma.Respirology. 2011 Apr;16(3):396-406. doi: 10.1111/j.1440-1843.2011.01939.x. Respirology. 2011. PMID: 21276132 Review.
-
Candidate gene association studies: successes and failures.Curr Opin Genet Dev. 2010 Jun;20(3):257-61. doi: 10.1016/j.gde.2010.03.006. Epub 2010 Apr 21. Curr Opin Genet Dev. 2010. PMID: 20417090 Free PMC article. Review.
Cited by
-
Association Between Variants in Calcineurin Inhibitor Pharmacokinetic and Pharmacodynamic Genes and Renal Dysfunction in Adult Heart Transplant Recipients.Front Genet. 2021 Apr 1;12:658983. doi: 10.3389/fgene.2021.658983. eCollection 2021. Front Genet. 2021. PMID: 33868389 Free PMC article.
-
IL-18 induces airway hyperresponsiveness and pulmonary inflammation via CD4+ T cell and IL-13.PLoS One. 2013;8(1):e54623. doi: 10.1371/journal.pone.0054623. Epub 2013 Jan 29. PLoS One. 2013. PMID: 23382928 Free PMC article.
-
IL1RL1 gene variants and nasopharyngeal IL1RL-a levels are associated with severe RSV bronchiolitis: a multicenter cohort study.PLoS One. 2012;7(5):e34364. doi: 10.1371/journal.pone.0034364. Epub 2012 May 4. PLoS One. 2012. PMID: 22574108 Free PMC article.
-
Assessing the validity of asthma associations for eight candidate genes and age at diagnosis effects.PLoS One. 2013 Sep 9;8(9):e73157. doi: 10.1371/journal.pone.0073157. eCollection 2013. PLoS One. 2013. PMID: 24039878 Free PMC article.
-
Genetics of asthma and allergy: what have we learned?J Allergy Clin Immunol. 2010 Sep;126(3):439-46; quiz 447-8. doi: 10.1016/j.jaci.2010.07.012. J Allergy Clin Immunol. 2010. PMID: 20816180 Free PMC article. Review.
References
-
- Moffatt MF, Kabesch M, Liang L, Dixon AL, Strachan D, Heath S, et al. Genetic variants regulating ORMDL3 expression contribute to the risk of childhood asthma. Nature. 2007;448:470–473. - PubMed
-
- Ober C, Hoffjan S. Asthma genetics 2006: the long and winding road to gene discovery. Genes Immun. 2006;7:95–100. - PubMed
-
- Chanock SJ, Manolio T, Boehnke M, Boerwinkle E, Hunter DJ, Thomas G, et al. Replicating genotype-phenotype associations. Nature. 2007;447:655–660. - PubMed
Publication types
MeSH terms
Grants and funding
LinkOut - more resources
Full Text Sources
Other Literature Sources
Medical
Miscellaneous
