

Co-expression networks: graph properties and topological comparisons
- PMID: 19910304
- PMCID: PMC2804297
- DOI: 10.1093/bioinformatics/btp632
Co-expression networks: graph properties and topological comparisons
Abstract
Motivation: Microarray-based gene expression data have been generated widely to study different biological processes and systems. Gene co-expression networks are often used to extract information about groups of genes that are 'functionally' related or co-regulated. However, the structural properties of such co-expression networks have not been rigorously studied and fully compared with known biological networks. In this article, we aim at investigating the structural properties of co-expression networks inferred for the species Saccharomyces Cerevisiae and comparing them with the topological properties of the known, well-established transcriptional network, MIPS physical network and protein-protein interaction (PPI) network of yeast.
Results: These topological comparisons indicate that co-expression networks are not distinctly related with either the PPI or the MIPS physical interaction networks, showing important structural differences between them. When focusing on a more literal comparison, vertex by vertex and edge by edge, the conclusion is the same: the fact that two genes exhibit a high gene expression correlation degree does not seem to obviously correlate with the existence of a physical binding between the proteins produced by these genes or the existence of a MIPS physical interaction between the genes. The comparison of the yeast regulatory network with inferred yeast co-expression networks would suggest, however, that they could somehow be related.
Conclusions: We conclude that the gene expression-based co-expression networks reflect more on the gene regulatory networks but less on the PPI or MIPS physical interaction networks.
Supplementary information: Supplementary data are available at Bioinformatics online.
Figures
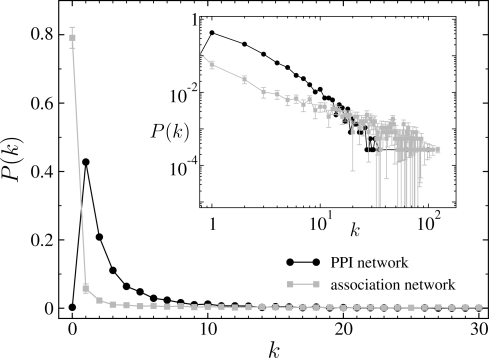

 , of the true MIPS network (cycles) and the corresponding co-expression network inferred by network inference procedure I (squares), indicating that the MIPS network is dissortative while the co-expression network is assortative. For the association network, the standard errors are also plotted based on 104 bootstrap samples.
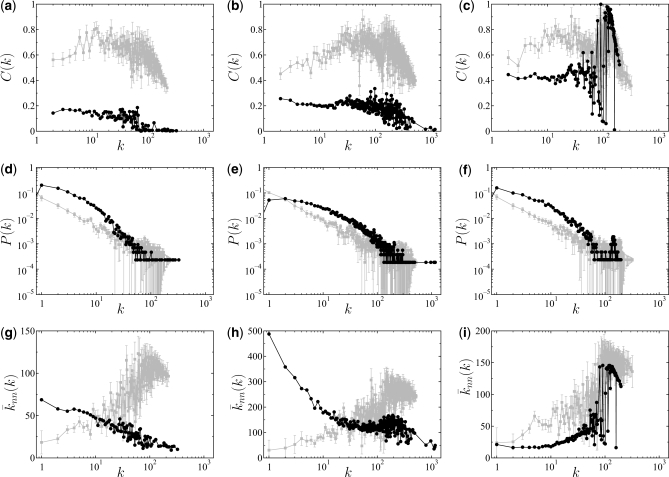
 , of the true protein-protein interaction networks (cycles) and the corresponding co-expression networks inferred by procedure I (squares). Note that panels (a) correspond to the direct physical BioGRID PPI network, panels (b) correspond to the entire BioGRID PPI network, and panels (c) correspond to the STRING PPI network (see text for details). For the co-expression networks, the standard errors are plotted based on 2000 bootstrap samples. The plots show (i) that the direct physical BioGRID PPI network is topologically different from its associated co-expression network (they show, for example, different types of degree-degree correlation and a big difference in C(k)), (ii) the topological differences between the entire BioGRID network and its associated co-expression networks are sensibly smaller and (iii) those differences, although still appreciable, begin to disappear when the compared networks are the STRING PPI and its associated co-expression network.
Similar articles
-
IRIS: a method for reverse engineering of regulatory relations in gene networks.BMC Bioinformatics. 2009 Dec 23;10:444. doi: 10.1186/1471-2105-10-444. BMC Bioinformatics. 2009. PMID: 20030818 Free PMC article.
-
L-GRAAL: Lagrangian graphlet-based network aligner.Bioinformatics. 2015 Jul 1;31(13):2182-9. doi: 10.1093/bioinformatics/btv130. Epub 2015 Feb 28. Bioinformatics. 2015. PMID: 25725498 Free PMC article.
-
Detecting functional modules in the yeast protein-protein interaction network.Bioinformatics. 2006 Sep 15;22(18):2283-90. doi: 10.1093/bioinformatics/btl370. Epub 2006 Jul 12. Bioinformatics. 2006. PMID: 16837529
-
Discerning molecular interactions: A comprehensive review on biomolecular interaction databases and network analysis tools.Gene. 2018 Feb 5;642:84-94. doi: 10.1016/j.gene.2017.11.028. Epub 2017 Nov 10. Gene. 2018. PMID: 29129810 Review.
-
Transcriptional networks: reverse-engineering gene regulation on a global scale.Curr Opin Microbiol. 2004 Dec;7(6):638-46. doi: 10.1016/j.mib.2004.10.009. Curr Opin Microbiol. 2004. PMID: 15556037 Review.
Cited by
-
Anomalies in network bridges involved in bile Acid metabolism predict outcomes of colorectal cancer patients.PLoS One. 2014 Sep 26;9(9):e107925. doi: 10.1371/journal.pone.0107925. eCollection 2014. PLoS One. 2014. PMID: 25259881 Free PMC article.
-
A network-based computational framework to predict and differentiate functions for gene isoforms using exon-level expression data.Methods. 2021 May;189:54-64. doi: 10.1016/j.ymeth.2020.06.005. Epub 2020 Jun 10. Methods. 2021. PMID: 32534132 Free PMC article.
-
Expression profile analysis of sheep ovary after superovulation and estrus synchronisation treatment.Vet Med Sci. 2022 May;8(3):1276-1287. doi: 10.1002/vms3.783. Epub 2022 Mar 19. Vet Med Sci. 2022. PMID: 35305293 Free PMC article.
-
Network-based protein-protein interaction prediction method maps perturbations of cancer interactome.PLoS Genet. 2021 Nov 2;17(11):e1009869. doi: 10.1371/journal.pgen.1009869. eCollection 2021 Nov. PLoS Genet. 2021. PMID: 34727106 Free PMC article.
-
Loss of connectivity in cancer co-expression networks.PLoS One. 2014 Jan 28;9(1):e87075. doi: 10.1371/journal.pone.0087075. eCollection 2014. PLoS One. 2014. PMID: 24489837 Free PMC article.
References
-
- Albert R, Barabási AL. Statistical mechanics of complex networks. Rev. Mod. Phys. 2002;74:47.
-
- Anderson TW. An Introduction to Multivariate Statistical Analysis. 3rd. Hoboken, NJ: John Wiley and Sons; 2003.
-
- Bhardwaj N, Lu H. Correlation between gene expression profiles and protein-protein interactions within and across genomes. Bioinformatics. 2005;21:2730–2738. - PubMed
Publication types
MeSH terms
Grants and funding
LinkOut - more resources
Full Text Sources
Molecular Biology Databases
