

Respiratory restriction and elevated pleural and esophageal pressures in morbid obesity
- PMID: 19910329
- PMCID: PMC2885073
- DOI: 10.1152/japplphysiol.91356.2008
Respiratory restriction and elevated pleural and esophageal pressures in morbid obesity
Abstract
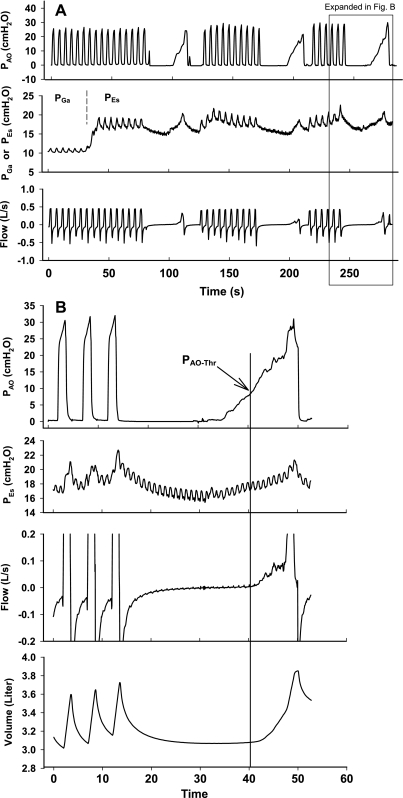
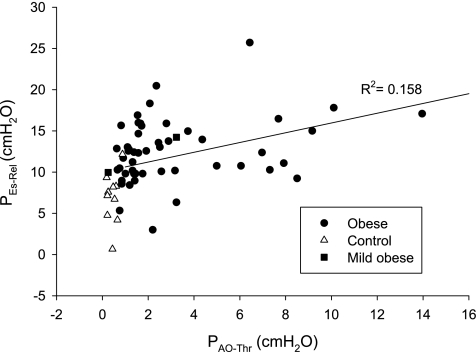
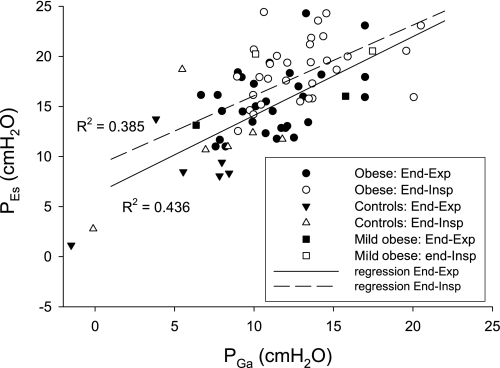
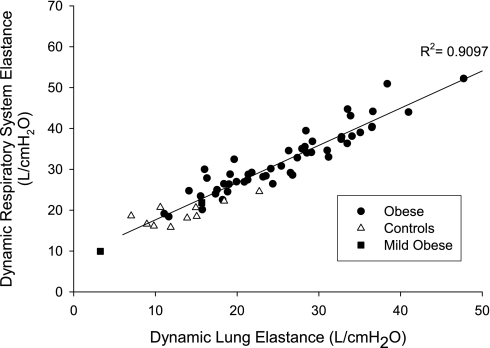
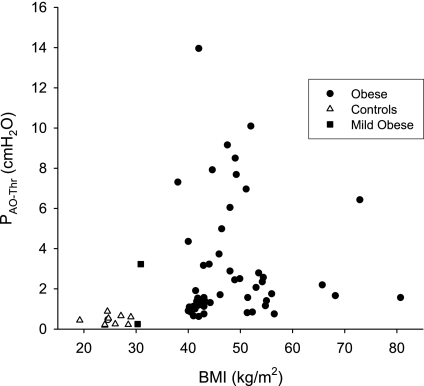
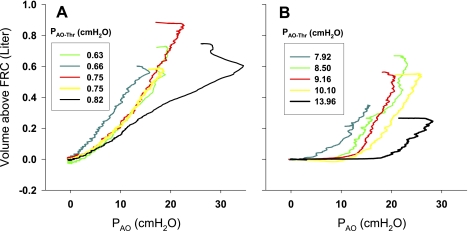
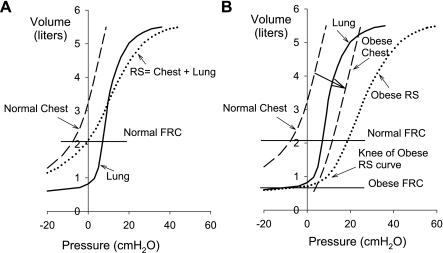
To explore mechanisms of restrictive respiratory physiology and high pleural pressure (P(Pl)) in severe obesity, we studied 51 obese subjects (body mass index = 38-80.7 kg/m(2)) and 10 nonobese subjects, both groups without lung disease, anesthetized, and paralyzed for surgery. We measured esophageal and gastric pressures (P(Es), P(Ga)) using a balloon-catheter, airway pressure (P(AO)), flow, and volume. We compared P(Es) to another estimate of P(Pl) based on P(AO) and flow. Reasoning that the lungs would not inflate until P(AO) exceeded alveolar and pleural pressures (P(AO) > P(Alv) > P(Pl)), we disconnected subjects from the ventilator for 10-15 s to allow them to reach relaxation volume (V(Rel)) and then slowly raised P(AO) until lung volume increased by 10 ml, indicating the "threshold P(AO)" (P(AO-Thr)) for inflation, which we took to be an estimate of the lowest P(Alv) or P(Pl) to be found in the chest at V(Rel). P(AO-Thr) ranged from 0.6 to 14.0 cmH2O in obese and 0.2 to 0.9 cmH2O in control subjects. P(Es) at V(Rel) was higher in obese than control subjects (12.5 +/- 3.9 vs. 6.9 +/- 3.1 cmH2O, means +/- SD; P = 0.0002) and correlated with P(AO-Thr) (R(2) = 0.16, P = 0.0015). Respiratory system compliance (C(RS)) was lower in obese than control (0.032 +/- 0.008 vs. 0.053 +/- 0.007 l/cmH2O) due principally to lower lung compliance (0.043 +/- 0.016 vs. 0.084 +/- 0.029 l/cmH2O) rather than chest wall compliance (obese 0.195 +/- 0.109, control 0.223 +/- 0.132 l/cmH2O). We conclude that many severely obese supine subjects at relaxation volume have positive P(pl) throughout the chest. High P(Es) suggests high P(Pl) in such individuals. Lung and respiratory system compliances are low because of breathing at abnormally low lung volumes.
Figures
References
-
- Collee GG, Lomax DM, Ferguson C, Hanson GC. Bedside measurement of intra-abdominal pressure (IAP) via an indwelling naso-gastric tube: clinical validation of the technique. Intensive Care Med 19: 478–480, 1993 - PubMed
-
- Frazer DG, Stengel PW, Weber KC. Meniscus formation in airways of excised rat lungs. Respir Physiol 36: 121–129, 1979 - PubMed
-
- Fry DL, Stead WW, Ebert RV, Lubin RI, Wells HS. The meaurement of intraesophageal pressure and its relationship to intrathoracic pressure. J Lab Clin Med 40: 664–673, 1952 - PubMed
-
- Hedenstierna G, Rothen HU. Atelectasis formation during anesthesia: causes and measures to prevent it. J Clin Monit Comput 16: 329–335, 2000 - PubMed
-
- Hedenstierna G, Santesson J. Breathing mechanics, dead space and gas exchange in the extremely obese, breathing spontaneously and during anaesthesia with intermittent positive pressure ventilation. Acta Anaesthesiol Scand 20: 248–254, 1976 - PubMed
Publication types
MeSH terms
Grants and funding
LinkOut - more resources
Full Text Sources
Medical