

Quantitative analysis of ribosome-mRNA complexes at different translation stages
- PMID: 19910372
- PMCID: PMC2817456
- DOI: 10.1093/nar/gkp1025
Quantitative analysis of ribosome-mRNA complexes at different translation stages
Abstract
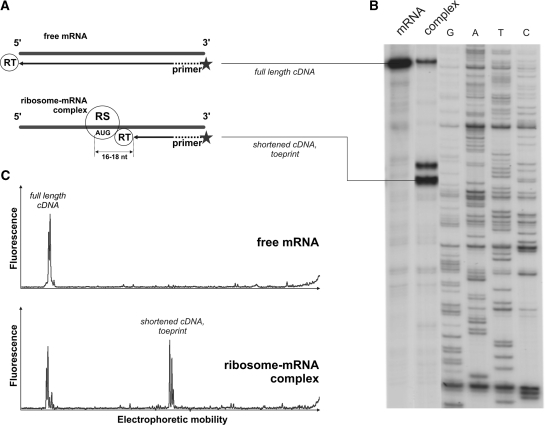
Inhibition of primer extension by ribosome-mRNA complexes (toeprinting) is a proven and powerful technique for studying mechanisms of mRNA translation. Here we have assayed an advanced toeprinting approach that employs fluorescently labeled DNA primers, followed by capillary electrophoresis utilizing standard instruments for sequencing and fragment analysis. We demonstrate that this improved technique is not merely fast and cost-effective, but also brings the primer extension inhibition method up to the next level. The electrophoretic pattern of the primer extension reaction can be characterized with a precision unattainable by the common toeprint analysis utilizing radioactive isotopes. This method allows us to detect and quantify stable ribosomal complexes at all stages of translation, including initiation, elongation and termination, generated during the complete translation process in both the in vitro reconstituted translation system and the cell lysate. We also point out the unique advantages of this new methodology, including the ability to assay sites of the ribosomal complex assembly on several mRNA species in the same reaction mixture.
Figures
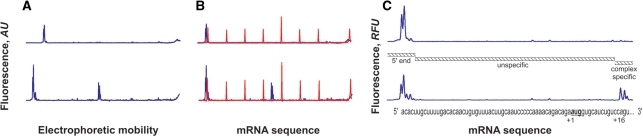
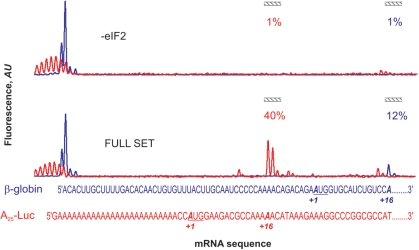
 were present in the reaction mixture. Upper curves are the result of a control reaction where eIF2 was excluded. (A) The original fluorescence readout of the capillary electrophoresis. (B) Same as (A), but the cDNA peaks of fluorescence (blue line) were aligned with the mRNA sequence using Promega CXR size standards (red line). (C) Scaled region of (B) between the 5′-end and toeprint signals, normalized by the integral fluorescence intensity. The aligned β-globin mRNA sequence is shown in the bottom. Three main electrophoregram zones are indicated (see text).
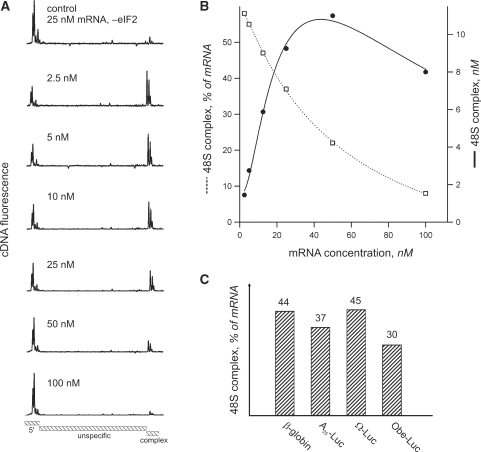
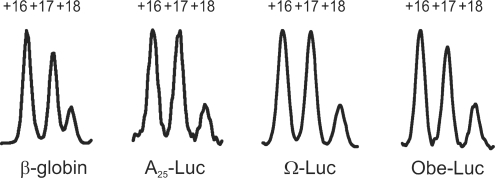
 where present in the reaction mixture. (A) Aligned and normalized electrophoregrams of 48S complex toeprint analysis at indicated β-globin mRNA concentrations. (B) Dependency of the 48S complex concentration (solid line) and relative yield (dashed line) on the β-globin mRNA concentration in the reaction mixture. (C) Comparison of 48S complex formation on different messages. Indicated mRNAs were present in the reaction mixture at the same concentration of 15 nM.
Similar articles
-
Fluorescent toeprinting to study the dynamics of ribosomal complexes.Methods. 2019 Jun 1;162-163:54-59. doi: 10.1016/j.ymeth.2019.06.010. Epub 2019 Jun 13. Methods. 2019. PMID: 31201933 Review.
-
Toeprinting.Cold Spring Harb Protoc. 2013 Sep 1;2013(9):896-9. doi: 10.1101/pdb.prot077180. Cold Spring Harb Protoc. 2013. PMID: 24003204
-
Translation toeprinting assays using fluorescently labeled primers and capillary electrophoresis.Biotechniques. 2005 Mar;38(3):397-400. doi: 10.2144/05383ST02. Biotechniques. 2005. PMID: 15786806
-
Translation complex profile sequencing to study the in vivo dynamics of mRNA-ribosome interactions during translation initiation, elongation and termination.Nat Protoc. 2017 Apr;12(4):697-731. doi: 10.1038/nprot.2016.189. Epub 2017 Mar 2. Nat Protoc. 2017. PMID: 28253237
-
Modifications of Ribosome Profiling that Provide New Data on the Translation Regulation.Biochemistry (Mosc). 2021 Sep;86(9):1095-1106. doi: 10.1134/S0006297921090054. Biochemistry (Mosc). 2021. PMID: 34565313 Review.
Cited by
-
Rocaglates convert DEAD-box protein eIF4A into a sequence-selective translational repressor.Nature. 2016 Jun 23;534(7608):558-61. doi: 10.1038/nature17978. Epub 2016 Jun 15. Nature. 2016. PMID: 27309803 Free PMC article.
-
High-Efficiency "-1" and "-2" Ribosomal Frameshiftings Revealed by Force Spectroscopy.ACS Chem Biol. 2017 Jun 16;12(6):1629-1635. doi: 10.1021/acschembio.7b00028. Epub 2017 May 2. ACS Chem Biol. 2017. PMID: 28437082 Free PMC article.
-
Two-step model of stop codon recognition by eukaryotic release factor eRF1.Nucleic Acids Res. 2013 Apr;41(8):4573-86. doi: 10.1093/nar/gkt113. Epub 2013 Feb 23. Nucleic Acids Res. 2013. PMID: 23435318 Free PMC article.
-
Eukaryotic translation elongation factor 2 (eEF2) catalyzes reverse translocation of the eukaryotic ribosome.J Biol Chem. 2018 Apr 6;293(14):5220-5229. doi: 10.1074/jbc.RA117.000761. Epub 2018 Feb 16. J Biol Chem. 2018. PMID: 29453282 Free PMC article.
-
Cellular mRNA recruits the ribosome via eIF3-PABP bridge to initiate internal translation.RNA Biol. 2017 May 4;14(5):553-567. doi: 10.1080/15476286.2015.1137419. Epub 2016 Feb 1. RNA Biol. 2017. PMID: 26828225 Free PMC article.
References
-
- Hartz D, McPheeters DS, Traut R, Gold L. Extension inhibition analysis of translation initiation complexes. Methods Enzymol. 1988;164:419–425. - PubMed
-
- Anthony DD, Merrick WC. Analysis of 40 S and 80 S complexes with mRNA as measured by sucrose density gradients and primer extension inhibition. J. Biol. Chem. 1992;267:1554–1562. - PubMed
-
- Alkalaeva EZ, Pisarev AV, Frolova LY, Kisselev LL, Pestova TV. In vitro reconstitution of eukaryotic translation reveals cooperativity between release factors eRF1 and eRF3. Cell. 2006;125:1125–1136. - PubMed
-
- Sachs MS, Wang Z, Gaba A, Fang P, Belk J, Ganesan R, Amrani N, Jacobson A. Toeprint analysis of the positioning of translation apparatus components at initiation and termination codons of fungal mRNAs. Methods. 2002;26:105–114. - PubMed
