. 2009 Dec 15;170(12):1555-62.
doi: 10.1093/aje/kwp309. Epub 2009 Nov 12.

A family longevity selection score: ranking sibships by their longevity, size, and availability for study

Affiliations

A family longevity selection score: ranking sibships by their longevity, size, and availability for study

Paola Sebastiani et al. Am J Epidemiol. .

Abstract

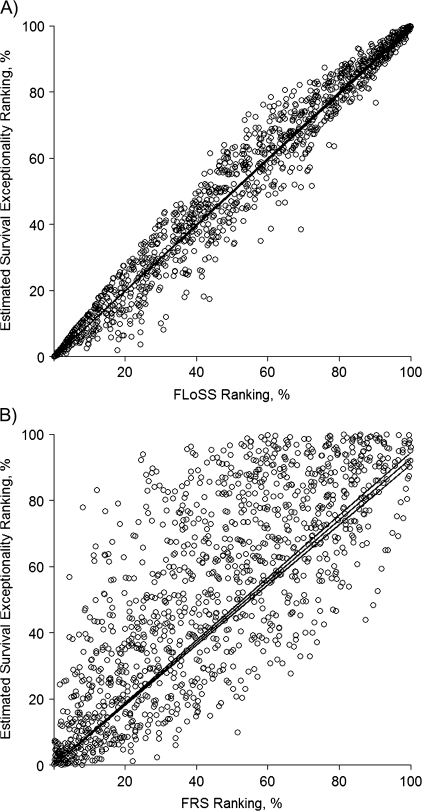
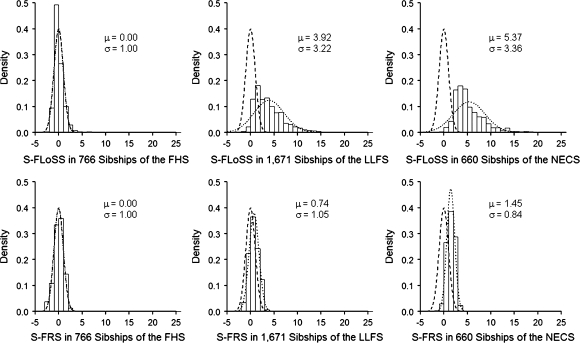
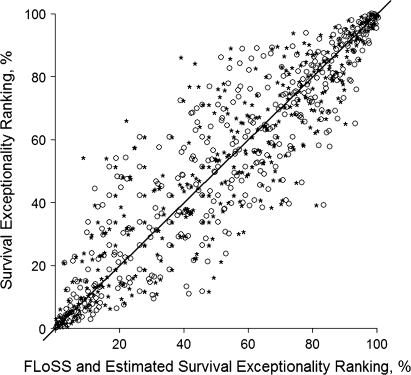
Family studies of exceptional longevity can potentially identify genetic and other factors contributing to long life and healthy aging. Although such studies seek families that are exceptionally long lived, they also need living members who can provide DNA and phenotype information. On the basis of these considerations, the authors developed a metric to rank families for selection into a family study of longevity. Their measure, the family longevity selection score (FLoSS), is the sum of 2 components: 1) an estimated family longevity score built from birth-, gender-, and nation-specific cohort survival probabilities and 2) a bonus for older living siblings. The authors examined properties of FLoSS-based family rankings by using data from 3 ongoing studies: the New England Centenarian Study, the Framingham Heart Study, and screenees for the Long Life Family Study. FLoSS-based selection yields families with exceptional longevity, satisfactory sibship sizes and numbers of living siblings, and high ages. Parameters in the FLoSS formula can be tailored for studies of specific populations or age ranges or with different conditions. The first component of the FLoSS also provides a conceptually sound survival measure to characterize exceptional longevity in individuals or families in various types of studies and correlates well with later-observed longevity.


Figures

Figure 1.
Figure 1.
Characteristics of Long Life Family Study sibships in 2007 as ranked by the family longevity selection score (FLoSS) (A) and the family risk score (FRS) (B). These plots show the relation between the percentile ranking of the sibships screened for the Long Life Family Study based on the estimated survival exceptionality, est(SE), on the y axis and the percentile ranking based on the family longevity selection score on the x axis of part A and the family risk score on the x axis of part B. Diagonal lines represent least-square regression lines and 95% confidence bounds. Note that the 3 lines essentially overlap in the plot of part A.
Figure 2.
Figure 2.
Distribution of the standardized family longevity selection score (S-FLoSS) and the standardized family risk score (S-FRS) for sibships from the Framingham Heart Study (FHS), the Long Life Family Study (LLFS) screenees, and the New England Centenarian Study (NECS). S-FLoSS is defined as (FLoSS − M)/S, where M = −0.24 and S = 1.47 are, respectively, the mean and standard deviation of FLoSS scores in the FHS cohort. S-FRS is defined analogously (i.e., as a z score in the same cohort, with M = 1.98 and S = 1.30). Parameters μ and σ in each panel are the mean and standard deviation of standardized scores. Dashed lines represent the standard normal density, and dotted lines represent the normal density with mean and standard deviation of the S-FLoSS and S-FRS. The S-FLoSS values for the LLFS and NECS sibships are significantly different from the S-FLoSS values for the FHS sibships (P < 0.0000; Wilcoxon test). Similarly, the S-FRS values for the LLFS and NECS sibships are significantly different from the S-FRS values for the FHS sibships (P < 0.0000; Wilcoxon test).
Figure 3.
Figure 3.
Rankings for survival exceptionality versus family longevity selection score (FLoSS) and estimated survival exceptionality (est(SE)) among 442 New England Centenarian Study sibships with final survivors’ deaths within 10 years after 1995. For each of the 442 New England Centenarian Study sibships with at least 1 living member in 1995 and none in 2004, an open circle relates its percentile ranking based on observed survival exceptionality in 2004 on the y axis to its 1995 family longevity selection score percentile ranking on the x axis. Stars show the same relation for a sibship's percentile ranking based on survival exceptionality in 2004 (on the y axis) and percentile ranking based on its 1995 estimated survival exceptionality on the x axis.

References

    1. Kerber RA, O'Brien E, Smith KR, et al. Familial excess longevity in Utah genealogies. J Gerontol A Biol Sci Med Sci. 2001;56(3):B130–B139. - PubMed
    1. Perls TT, Wilmoth J, Levenson R, et al. Life-long sustained mortality advantage of siblings of centenarians. Proc Natl Acad Sci U S A. 2002;99(12):8442–8447. - PMC - PubMed
    1. Willcox BJ, Willcox DC, He Q, et al. Siblings of Okinawan centenarians share lifelong mortality advantages. J Gerontol A Biol Sci Med Sci. 2006;61(4):345–354. - PubMed
    1. Gudmundsson H, Gudbjartsson DF, Frigge M, et al. Inheritance of human longevity in Iceland. Eur J Hum Genet. 2000;8(10):743–749. - PubMed
    1. Christensen K, Johnson TE, Vaupel JW. The quest for genetic determinants of human longevity: challenges and insights. Nat Rev Genet. 2006;7(6):436–448. - PMC - PubMed

Publication types