

Wet phases in the Sahara/Sahel region and human migration patterns in North Africa
- PMID: 19910531
- PMCID: PMC2776605
- DOI: 10.1073/pnas.0905771106
Wet phases in the Sahara/Sahel region and human migration patterns in North Africa
Abstract
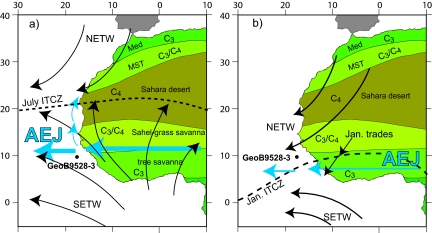
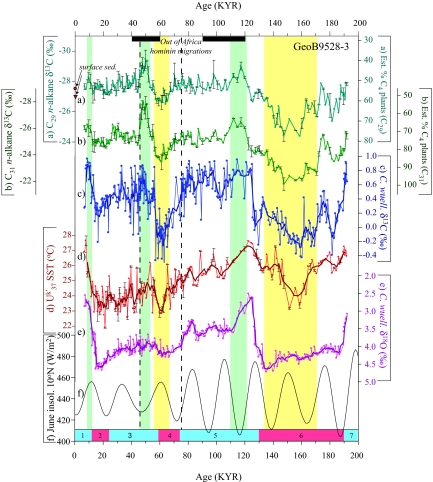
The carbon isotopic composition of individual plant leaf waxes (a proxy for C(3) vs. C(4) vegetation) in a marine sediment core collected from beneath the plume of Sahara-derived dust in northwest Africa reveals three periods during the past 192,000 years when the central Sahara/Sahel contained C(3) plants (likely trees), indicating substantially wetter conditions than at present. Our data suggest that variability in the strength of Atlantic meridional overturning circulation (AMOC) is a main control on vegetation distribution in central North Africa, and we note expansions of C(3) vegetation during the African Humid Period (early Holocene) and within Marine Isotope Stage (MIS) 3 ( approximately 50-45 ka) and MIS 5 ( approximately 120-110 ka). The wet periods within MIS 3 and 5 coincide with major human migration events out of sub-Saharan Africa. Our results thus suggest that changes in AMOC influenced North African climate and, at times, contributed to amenable conditions in the central Sahara/Sahel, allowing humans to cross this otherwise inhospitable region.
Conflict of interest statement
The authors declare no conflict of interest.
Figures
Similar articles
-
Timing and causes of North African wet phases during the last glacial period and implications for modern human migration.Sci Rep. 2016 Nov 3;6:36367. doi: 10.1038/srep36367. Sci Rep. 2016. PMID: 27808237 Free PMC article.
-
Ancient watercourses and biogeography of the Sahara explain the peopling of the desert.Proc Natl Acad Sci U S A. 2011 Jan 11;108(2):458-62. doi: 10.1073/pnas.1012231108. Epub 2010 Dec 27. Proc Natl Acad Sci U S A. 2011. PMID: 21187416 Free PMC article.
-
A humid corridor across the Sahara for the migration of early modern humans out of Africa 120,000 years ago.Proc Natl Acad Sci U S A. 2008 Oct 28;105(43):16444-7. doi: 10.1073/pnas.0804472105. Epub 2008 Oct 20. Proc Natl Acad Sci U S A. 2008. PMID: 18936490 Free PMC article.
-
The Atlantic Meridional Overturning Circulation and Abrupt Climate Change.Ann Rev Mar Sci. 2017 Jan 3;9:83-104. doi: 10.1146/annurev-marine-010816-060415. Epub 2016 Oct 28. Ann Rev Mar Sci. 2017. PMID: 27814029 Review.
-
The carbon isotope composition of ancient CO2 based on higher-plant organic matter.Philos Trans A Math Phys Eng Sci. 2002 Apr 15;360(1793):633-58. doi: 10.1098/rsta.2001.0965. Philos Trans A Math Phys Eng Sci. 2002. PMID: 12804297 Review.
Cited by
-
Human migration: Climate and the peopling of the world.Nature. 2016 Oct 6;538(7623):49-50. doi: 10.1038/nature19471. Epub 2016 Sep 21. Nature. 2016. PMID: 27654915 No abstract available.
-
North African fox genomes show signatures of repeated introgression and adaptation to life in deserts.Nat Ecol Evol. 2023 Aug;7(8):1267-1286. doi: 10.1038/s41559-023-02094-w. Epub 2023 Jun 12. Nat Ecol Evol. 2023. PMID: 37308700 Free PMC article.
-
Intensity of African Humid Periods Estimated from Saharan Dust Fluxes.PLoS One. 2017 Jan 27;12(1):e0170989. doi: 10.1371/journal.pone.0170989. eCollection 2017. PLoS One. 2017. PMID: 28129378 Free PMC article.
-
Asynchronous changes in vegetation, runoff and erosion in the nile river watershed during the holocene.PLoS One. 2014 Dec 31;9(12):e115958. doi: 10.1371/journal.pone.0115958. eCollection 2014. PLoS One. 2014. PMID: 25551633 Free PMC article.
-
A New Chronology for Rhafas, Northeast Morocco, Spanning the North African Middle Stone Age through to the Neolithic.PLoS One. 2016 Sep 21;11(9):e0162280. doi: 10.1371/journal.pone.0162280. eCollection 2016. PLoS One. 2016. PMID: 27654350 Free PMC article.
References
-
- DeMenocal P, et al. Abrupt onset and termination of the African Humid Period: Rapid climate responses to gradual insolation forcing. Q Sci Rev. 2000;19:347–361.
-
- Kuper R, Kröpelin S. Climate-controlled Holocene occupation in the Sahara: Motor of Africa's evolution. Science. 2006;313:803–807. - PubMed
-
- Claussen M, et al. Simulation of an abrupt change in Saharan vegetation in the mid-Holocene. Geophys Res Lett. 1999;26:2037–2040.
-
- Schefuß E, Schouten S, Jansen JHF, Sinninghe Damsté JS. African vegetation controlled by tropical sea surface temperatures in the mid-Pleistocene period. Nature. 2003;422:418–421. - PubMed
-
- Behrensmeyer AK. Climate change and human evolution. Science. 2006;311:476–478. - PubMed
Publication types
MeSH terms
Substances
LinkOut - more resources
Full Text Sources
Miscellaneous
