. 2010 May;17(5):774-86.
doi: 10.1038/cdd.2009.175. Epub 2009 Nov 13.

AATF mediates an antiapoptotic effect of the unfolded protein response through transcriptional regulation of AKT1

Affiliations

AATF mediates an antiapoptotic effect of the unfolded protein response through transcriptional regulation of AKT1

S Ishigaki et al. Cell Death Differ. 2010 May.

Abstract

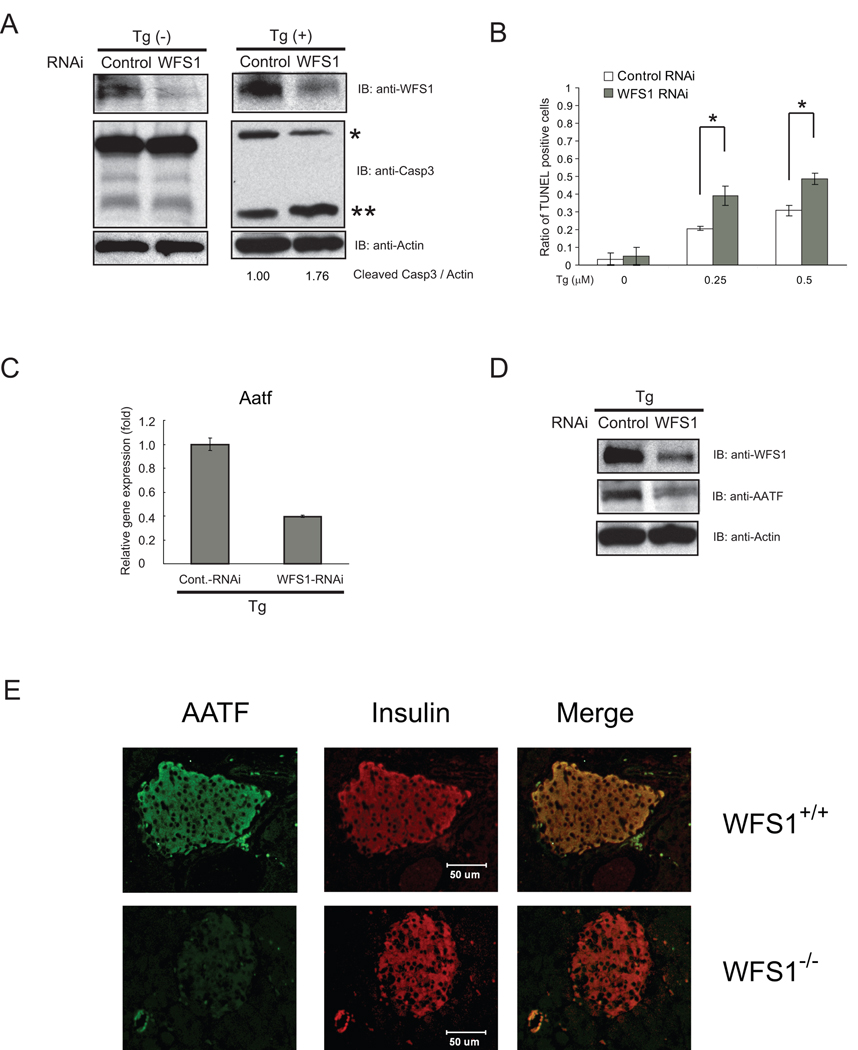
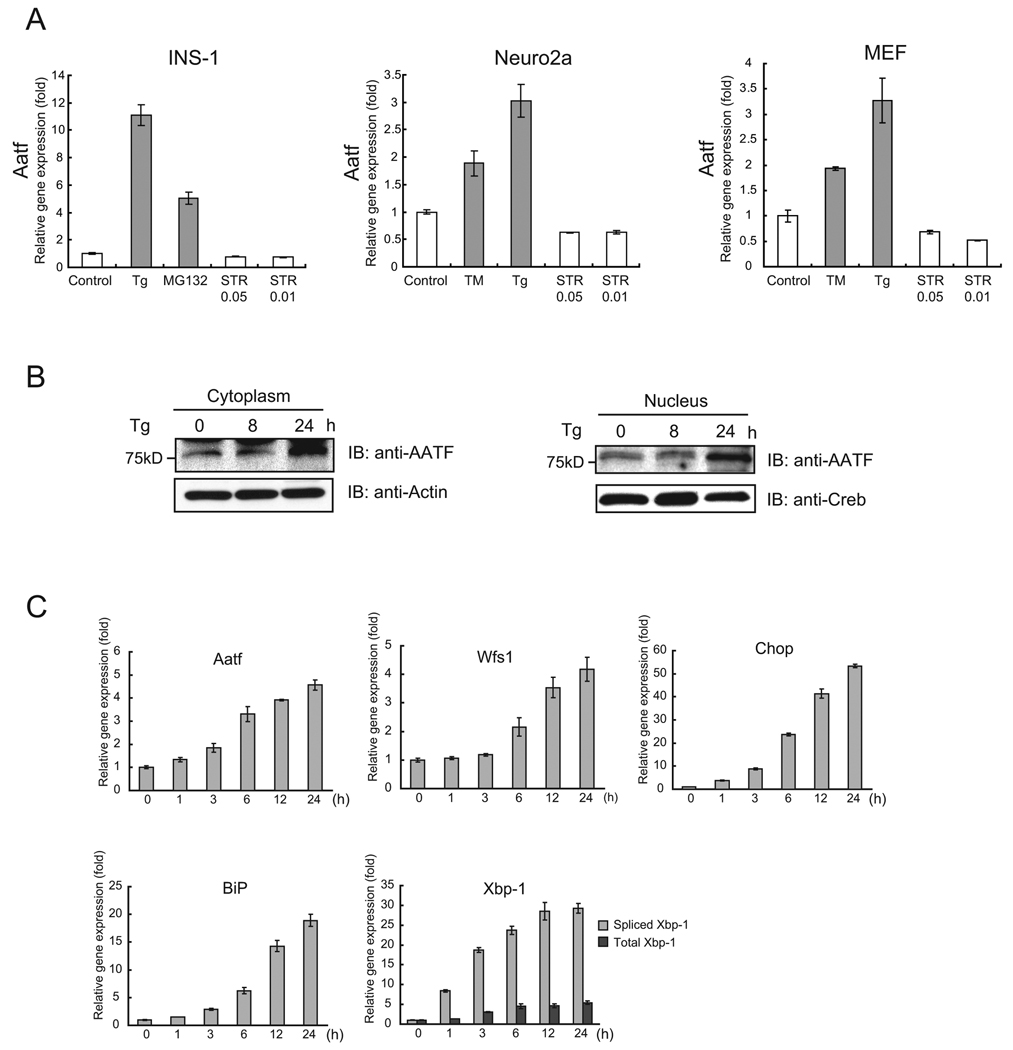
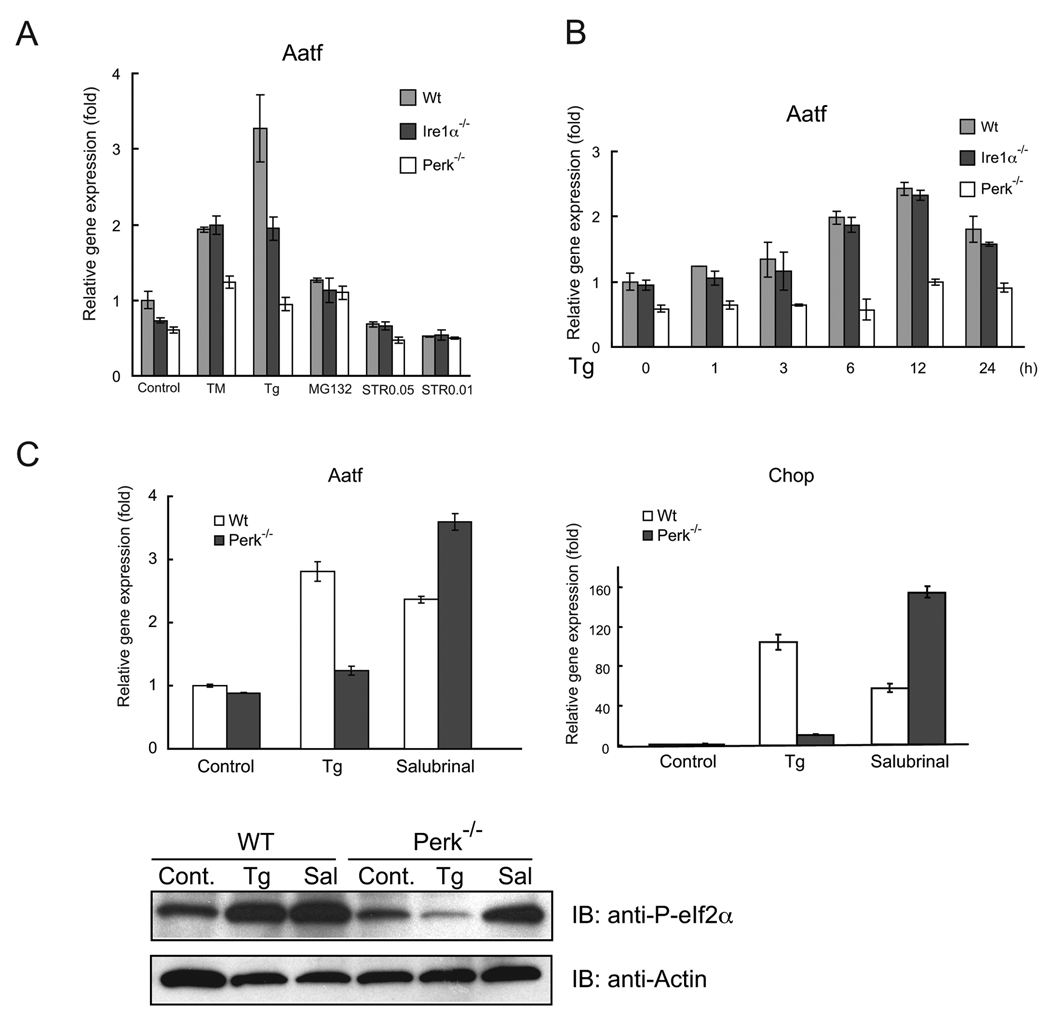
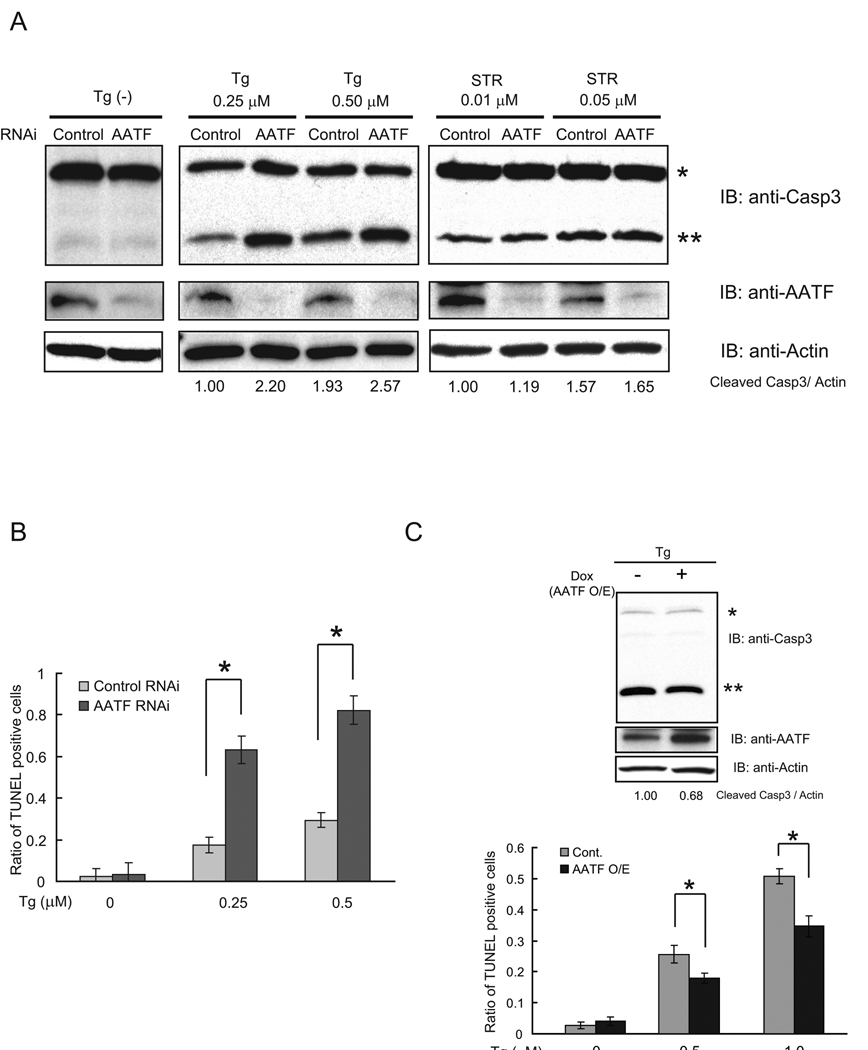
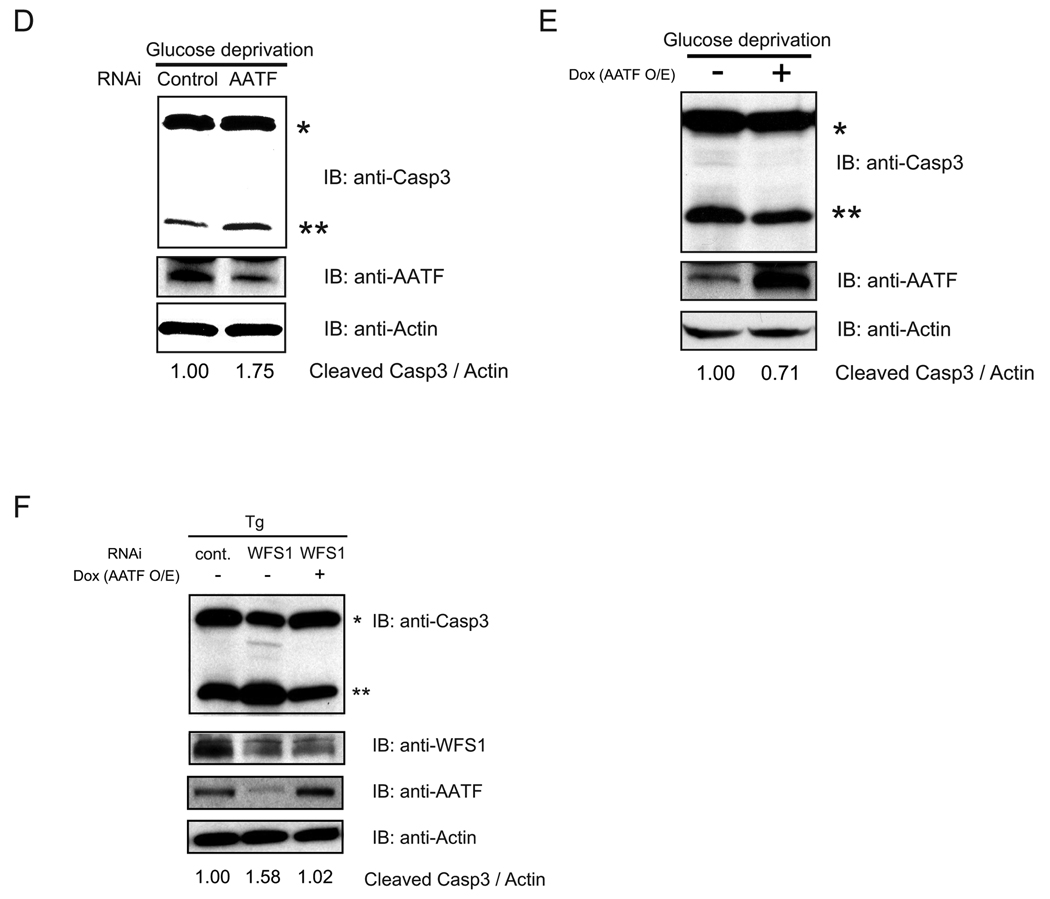
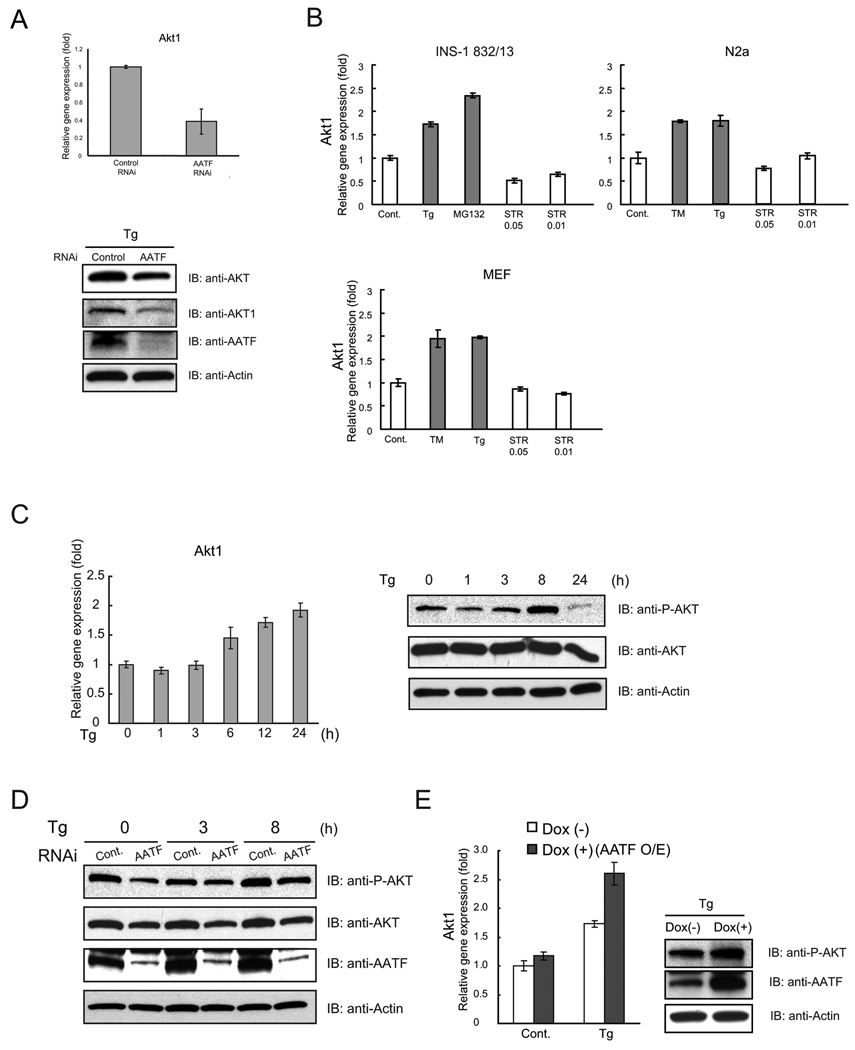
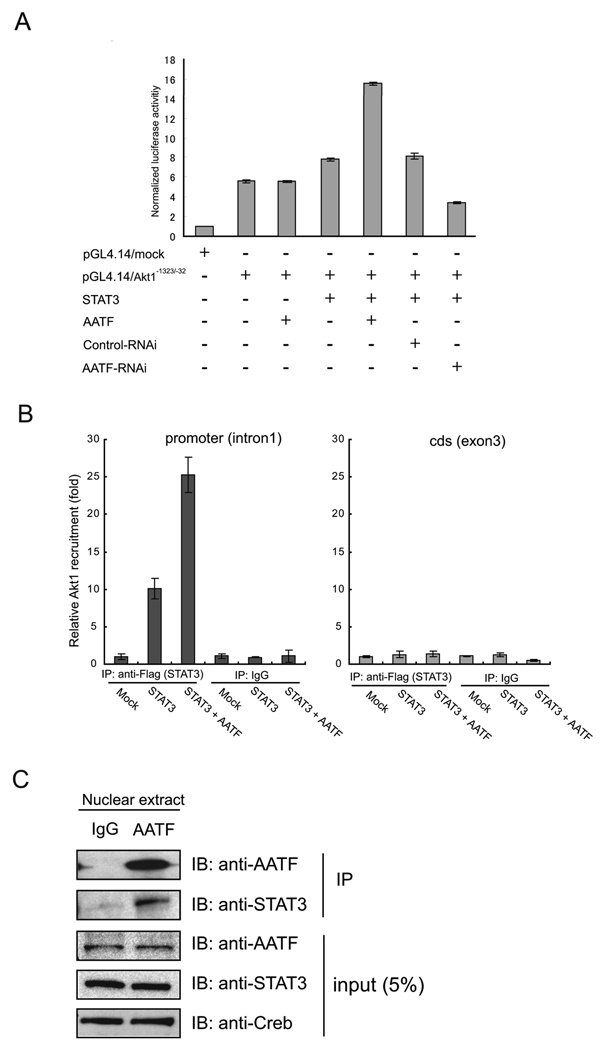
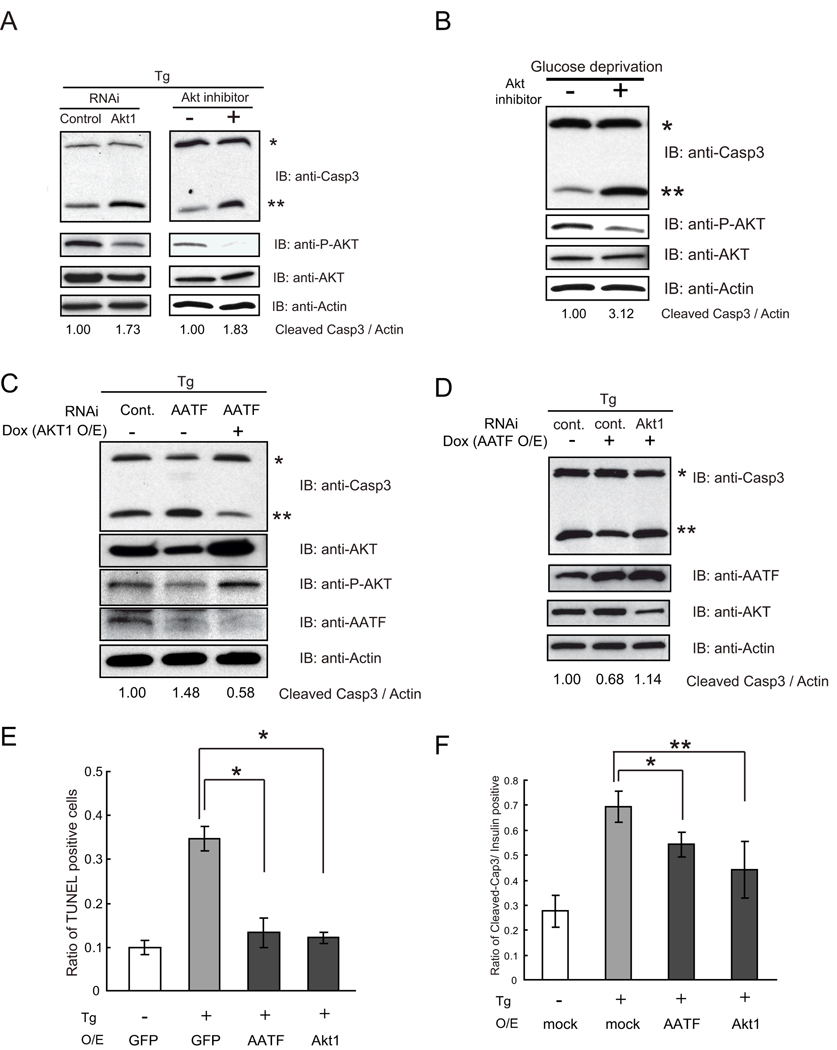
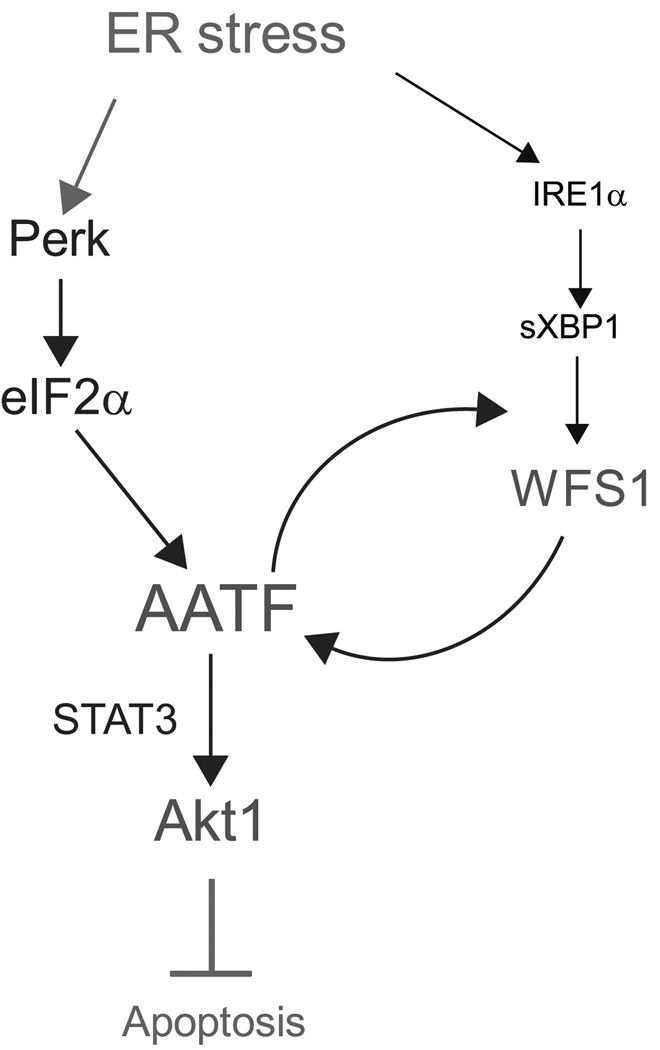
Endoplasmic reticulum (ER) stress-mediated cell death has an important role in the pathogenesis of chronic diseases, including diabetes and neurodegeneration. Although proapoptotic programs activated by ER stress have been extensively studied, identification and characterization of antiapoptotic programs that counteract ER stress are currently incomplete. Through the gene expression profiling of beta-cells lacking Wolfram syndrome 1 gene (WFS1), a causative gene for Wolfram syndrome, we discovered a novel antiapoptotic gene of the unfolded protein response (UPR), apoptosis antagonizing transcription factor (AATF). Here, we study the regulation of AATF, identify its target genes, and determine the basis for its antiapoptotic activities in response to ER stress. We show that AATF is induced by ER stress through the PERK-eIF2alpha pathway and transcriptionally activates the v-akt murine thymoma viral oncogene homolog 1 (AKT1) gene through signal transducer and activator of transcription 3 (Stat3), which sustains Akt1 activation and promotes cell survival. Ectopic expression of AATF or a constitutively active form of AKT1 confers on cells resistance to ER stress-mediated cell death, whereas RNAi-mediated knockdown of AATF or AKT1 renders cells sensitive to ER stress. We also discovered a positive crosstalk between the AATF and WFS1 signaling pathways. Thus, WFS1 deficiency or AATF deficiency mediates a self-perpetuating cycle of cell death. Our results reveal a novel antiapoptotic program relevant to the treatment of diseases caused by ER stress-mediated cell death.


Figures

Figure 1
Figure 1. AATF is downregulated in WFS1-deficient β-cells which are susceptible to ER stress-mediated apoptosis
(A) INS1 832/13 cells were transfected with control scramble siRNA or siRNA directed against WFS1, then treated with or without thapsigargin (Tg, 0.5 µM) for 16 hr. Expression levels of caspase-3 (Casp3), WFS1, and actin were measured by immunoblot. Single and double asterisks indicate uncleaved and cleaved caspase-3, respectively. The ratio between cleaved caspase-3 and actin was measured using ImageJ software. (B) INS1 832/13 cell were transfected with control scramble siRNA or siRNA directed against WFS1, then treated with three different concentrations (0, 0.25, and 0.5 µM) of thapsigargin (Tg) for 24 hr. Apoptotic cells were detected by TUNEL staining (n = 3; values are mean ± SD). Statistics were done by two-way ANOVA. *(p < 0.01) denotes significant differences between cells transfected with control scramble siRNA and siRNA directed against WFS1. (C) INS1 832/13 cells were transfected with control scramble siRNA or siRNA directed against WFS1, then treated with thapsigargin (Tg, 1 µM) for 8 hr. Expression levels of Aatf were measured by real-time PCR (n = 3; values are mean ± SD). (D) Expression levels of AATF, WFS1, and actin proteins were measured by immunoblot on the same samples as in (C). (E) WFS1 −/− and wild type littermate mouse pancreata were analyzed by immunohistochemistry using anti-AATF and anti-insulin antibodies. Merged image shows the co-localization of AATF and insulin.
Figure 2
Figure 2. AATF is induced by ER stress
(A) INS-1 832/13 cells, neuro2a cells, and mouse embryonic fibroblasts were treated with thapsigargin (Tg, 1 µM), MG132 (2 µM), tunicamycin (TM, 5 µg/ml), or staurosporin (STR, 0.05 µM and 0.01 µM) for 16 hr or untreated. Expression levels of Aatf were measured by real-time PCR (n = 3; values are mean ± SD). (B) INS-1 832/13 cells were treated with thapsigargin (Tg, 1 µM) for the indicated times (lower panel). Expression levels of Aatf and Creb were measured by immunoblot using cytoplasmic and nuclear extracts. (C) INS1 832/13 cells were treated with thapsigargin (Tg, 0.5 µM) for the indicated times. Expression levels of Aatf, Wfs1, Chop, BiP, and total and spliced Xbp-1 mRNA were measured by real-time PCR (n = 3; values are mean ± SD).
Figure 3
Figure 3. AATF expression is regulated by PERK-mediated eIF2α phosphorylation
(A) Wild-type (Wt), Ire1α−/−, and Perk−/− mouse embryonic fibroblasts were treated with tunicamycin (TM, 5 µg/ml), thapsigargin (Tg, 1 µM), or staurosporin (STR, 0.05 µM and 0.01 µM) for 16 hr or untreated. Expression levels of Aatf were measured by real-time PCR (n = 3; values are mean ± SD). (B) Wild type (Wt), Ire1α−/−, and Perk−/− mouse embryonic fibroblasts were treated with thapsigargin (Tg, 1 µM) at different times. Expression levels of Aatf were measured by real-time PCR (n = 3; values are mean ± SD). (C) Wild-type (Wt) and Perk−/− mouse embryonic fibroblasts were treated with thapsigargin (Tg, 1 µM) or Salubrinal (Sal, 75 nM) for 16 hr. Expression levels of Aatf (left panel) and Chop (right panel) were measured by real-time PCR (n = 3; values are mean ± SD). Expression levels of phosphorylated eIf2α and actin were measured by immunoblot.
Figure 4
Figure 4. AATF is an anti-apoptotic component of ER stress signaling
(A) INS1 832/13 cells were transfected with control scramble siRNA or siRNA directed against AATF, then treated with or without thapsigargin (Tg, 0.25 µM and 0.5 µM) or staurosporin (STR) for 16 hr. Expression levels of caspase-3 (Casp3), AATF, and actin were measured by immunoblot. Single and double asterisks indicate uncleaved and cleaved caspase-3, respectively. The ratio between cleaved caspase-3 and actin was measured using ImageJ software. (B) INS1 832/13 cell were transfected with control scramble siRNA or siRNA directed against AATF, then treated with three different concentrations (0, 0.25, and 0.5 µM) of thapsigargin (Tg) for 24 hr. Apoptotic cells were detected by TUNEL staining (n = 3; values are mean ± SD). Statistics were done by two-way ANOVA. *(p < 0.01) denotes significant differences between cells transfected with control scramble siRNA and siRNA directed against AATF. (C) INS-1 832/13 cells were stably transduced with LV-TO/AATF, an inducible lentivirus expressing AATF. Cells were cultured with doxycycline (2 µg/ml) to induce AATF or without doxycycline for 48 hr, then challenged with thapsigargin (Tg, 0.5 µM) for 16hr. Expression levels of caspase-3 (Casp3), AATF, and actin were measured by immunoblot. Single and double asterisks indicate uncleaved and cleaved caspase-3, respectively. The ratio between cleaved caspase-3 and actin was measured using ImageJ software (upper panel). Cells were cultured with doxycycline (2 µg/ml) to induce AATF (AATF O/E) or without doxycycline (Cont) for 48 hr, then challenged with three different concentrations of thapsigargin (0, 0.5, and 1.0 µM) for 24 hr. Apoptotic cell death was assessed by the TUNEL assay (n = 3; values are mean ± SD) Statistics were done by two-way ANOVA. *(p < 0.01) denotes significant differences between cells with and without doxycycline (lower panel). (D) INS-1 832/13 cells were transfected with control scramble siRNA (Control) or siRNA directed against AATF, then cultured in glucose-free media for 48 hr. Expression levels of caspase-3 (Casp3), AATF, and actin were measured by immunoblot. Single and double asterisks indicate uncleaved and cleaved caspase-3, respectively. The ratio between cleaved caspase-3 and actin was measured using ImageJ software. (E) INS1 832/13 cells were stably transduced with LV-TO/AATF, an inducible lentivirus expressing AATF. Cells were cultured with doxycycline (2 µg/ml) to induce AATF or without doxycycline (2 µg/ml) for 48 hr, then cultured in glucose-free media for 48 hr. Expression levels of caspase-3 (Casp3), AATF, and actin were measured by immunoblot. Single and double asterisks indicate uncleaved and cleaved caspase-3, respectively. The ratio between cleaved caspase-3 and actin was measured using ImageJ software. (F) INS-1 832/13 cells were stably transduced with LV-TO/AATF, an inducible lentivirus expressing mouse AATF. Cells were cultured with doxycycline (2 µg/ml) to induce AATF or without doxycyclin for 48 hr, then challenged with thapsigargin (Tg, 0.5 µM) for 16 hr. Cells were also transfected with control, scramble siRNA (Cont) or siRNA against WFS1. Expression levels of caspase-3 (Casp3), AATF, WFS1, and actin were measured by immunoblot. Single and double asterisks indicate uncleaved and cleaved caspase-3, respectively. The ratio between cleaved caspase-3 and actin was measured using ImageJ software.
Figure 5
Figure 5. Akt1 is a downstream target of AATF
(A) INS1 832/13 cells were transfected with scramble siRNA (control) or siRNA directed against AATF, and then challenged with thapsigargin (Tg, 1 µM) for 8 hr. Expression levels of Akt1 mRNA were measured by real-time PCR (n = 3; values are mean ± SD) (upper panel). Expression levels of total AKT (AKT), AKT1, AATF, and actin were measured by immunoblot (lower panel). (B) INS1 832/13 cells, neuro2a (N2a) cells, and mouse embryonic fibroblasts (MEF) were treated with thapsigargin (Tg, 1 µM), MG132 (2 µM), tunicamycin (TM, 5 µg/ml), or staurosporin (STR, 0.05 µM and 0.01 µM) for 16 hr or untreated. Expression levels of Akt1 were measured by real-time PCR (n = 3; values are mean ± SD) (C) INS1 832/13 cells were treated with thapsigargin (Tg, 1 µM) for the indicated times. Expression levels of Akt1 mRNA were measured by real-time PCR (n = 3; values are mean ± SD) (left panel). Expression levels of phosphorylated AKT (P-AKT), total AKT (AKT), and actin were also measured by immunoblot (right panel). (D) INS1 832/13 cells were transfected with scramble siRNA (control) or siRNA directed against AATF, then treated with thapsigargin (Tg) (0.5 µM) for the indicated times. Expression levels of phosphorylated AKT (P-AKT), total AKT (AKT), AATF, and actin were measured by immunoblot. (E) INS1 832/13 cells were stably transduced with LV-TO/AATF, an inducible lentivirus expressing AATF. Cells were cultured with or without doxycycline (Dox, 2 µg/ml) to induce AATF for 48 hr, then challenged with thapsigargin (Tg, 0.5 µM) for 16 hr. Expression levels of Akt1 mRNA were measured by real-time PCR (n = 3; values are mean ± SD) (left panel). Expression levels of phosphorylated AKT (P-AKT), AATF, and actin were also measured by immunoblot (right panel).
Figure 6
Figure 6. Regulation of Akt1 expression through the AATF-Stat3 complex
(A) Luciferase activity in neuro2a cells transfected with AKT1 (pGL4.14/Akt1−1323/−1) or control promoter constructs, plus vectors expressing the indicated proteins or siRNA directed against AATF (n = 3; values are mean ± SD). (B) Quantified ChIP analysis using real-time PCR was performed. Relative recruitment was defined as the ratio of amplification of the PCR product relative to 1% of input genomic DNA. Value obtained from mock was defined as 1 (n = 3; values are mean ± SD). (C) Nuclear fraction of HEK293T cells were extracted and applied for immunoprecipitation using an anti-AATF antibody. Immunoprecipitated samples and 5% inputs were blotted with indicated antibodies.
Figure 7
Figure 7. The AATF-AKT1 pathway protects cells from ER stress-mediated apoptosis
(A) INS1 832/13 cells were transfected with control scramble siRNA or siRNA against Akt1, then treated with 0.5 µM of thapsigargin (Tg) for 16 hr (left panel). INS1 832/13 cells were pretreated with 10 nM of Akt inhibitor (SH-5) or equivalent amount of DMSO (control) for overnight, then treated with 0.25 µM of thapsigargin (Tg) for 16 hr (right panel). Expression levels of caspase-3 (Casp3), phosphorylated AKT (P-AKT), total AKT (AKT), and actin were measured by immunoblot. Single and double asterisks indicate uncleaved and cleaved caspase-3, respectively. The ratio between cleaved caspase-3 and actin was measured using ImageJ software. (B) INS-1 832/13 cells were pretreated with 10 nM of Akt inhibitor (SH-5) or equivalent amount of DMSO overnight, then cultured in glucose-free media for 48 hr. Expression levels of caspase-3 (Casp3), phosphorylated AKT (P-AKT), total AKT (AKT), and actin were measured by immunoblot. Single and double asterisks indicate uncleaved and cleaved caspase-3, respectively. The ratio between cleaved caspase-3 and actin was measured using ImageJ software. (C) INS-1 832/13 cells were stably transduced with LV-TO/Akt1, an inducible lentivirus expressing the active form of Akt1. Cells were cultured with or without doxycycline (4 ng/ml) to induce Akt1 for 48 hr, then challenged with thapsigargin (Tg, 0.5 µM) for 16hr. Cells were also transfected with control scramble siRNA (Cont) or siRNA against AATF. Expression levels of caspase-3 (Casp3), total AKT (AKT), phosphorylated AKT (P-AKT), AATF, and actin were measured by immunoblot. Single and double asterisks indicate uncleaved and cleaved caspase-3, respectively. The ratio between cleaved caspase-3 and actin was measured using ImageJ software. (D) INS-1 832/13 cells were stably transduced with LV-TO/AATF, an inducible lentivirus expressing AATF. Cells were cultured with or without doxycycline (2 µg/ml) to induce AATF for 48 hr, then challenged with thapsigargin (Tg, 0.5 µM) for 16hr. Cells were also transfected with control scramble siRNA (Cont) or siRNA against Akt1. Expression levels of caspase-3 (Casp3), AATF, total AKT (AKT), and actin were measured by immunoblot. Single and double asterisks indicate uncleaved and cleaved caspase-3, respectively. The ratio between cleaved caspase-3 and actin was measured using ImageJ software. (E) Mouse primary islets were infected with LV-TO/AATF (AATF), LV-TO/Akt1 (Akt1), and LV-TO/GFP (GFP), lentiviruses expressing AATF, active form of Akt1, and GFP, respectively. GFP signals were positive in all the viable islets at 2 days after infection (Supplementary Figure 7A). Islets were then treated with thapsigargin (Tg, 0.5 µM) for 6 hr. Apoptotic cells were detected by TUNEL staining (n = 4; values are mean ± SD). Statistics were done by one-way ANOVA. *(p < 0.01) denotes significant differences between cells infected with GFP and AATF or Akt1. (F) Mouse primary islets were infected with LV-TO/AATF (AATF), LV-TO/Akt1 (Akt1), and empty LV-TO (mock) virus. Islets were then treated with thapsigargin (Tg, 0.5 µM) for 6hr. After dispersion, cells were fixed and stained with anti-cleaved caspase-3 and anti-insulin antibodies as shown in Supplementary Figure 7C. The ratio of cells with cleaved-caspase-3 signals to those with insulin signals was calculated (n = 4; values are mean ± SD). Statistics were done by one-way ANOVA. *(p < 0.05) and **(p < 0.01) denote significant differences between cells infected with mock, AATF, or Akt1, respectively.
Figure 8
Figure 8. The AATF-Akt1 pathway protects cells from ER stress-mediated apoptosis
Proposed pathway that protects cells from ER stress-mediated cell death.

References

    1. Ron D, Walter P. Signal integration in the endoplasmic reticulum unfolded protein response. Nat Rev Mol Cell Biol. 2007 Jul;8(7):519–529. - PubMed
    1. Rutkowski DT, Kaufman RJ. That which does not kill me makes me stronger: adapting to chronic ER stress. Trends Biochem Sci. 2007 Oct 4; - PubMed
    1. Szegezdi E, Logue SE, Gorman AM, Samali A. Mediators of endoplasmic reticulum stress-induced apoptosis. EMBO Rep. 2006 Sep;7(9):880–885. - PMC - PubMed
    1. Kim I, Xu W, Reed JC. Cell death and endoplasmic reticulum stress: disease relevance and therapeutic opportunities. Nature reviews. 2008 Dec;7(12):1013–1030. - PubMed
    1. Zinszner H, Kuroda M, Wang X, Batchvarova N, Lightfoot RT, Remotti H, et al. CHOP is implicated in programmed cell death in response to impaired function of the endoplasmic reticulum. Genes & Development. 1998;12(7):982–995. - PMC - PubMed

Publication types

MeSH terms