. 2009 Nov;5(11):e1000719.
doi: 10.1371/journal.pgen.1000719. Epub 2009 Nov 13.

Gene dosage, expression, and ontology analysis identifies driver genes in the carcinogenesis and chemoradioresistance of cervical cancer

Affiliations

Gene dosage, expression, and ontology analysis identifies driver genes in the carcinogenesis and chemoradioresistance of cervical cancer

Malin Lando et al. PLoS Genet. 2009 Nov.

Abstract

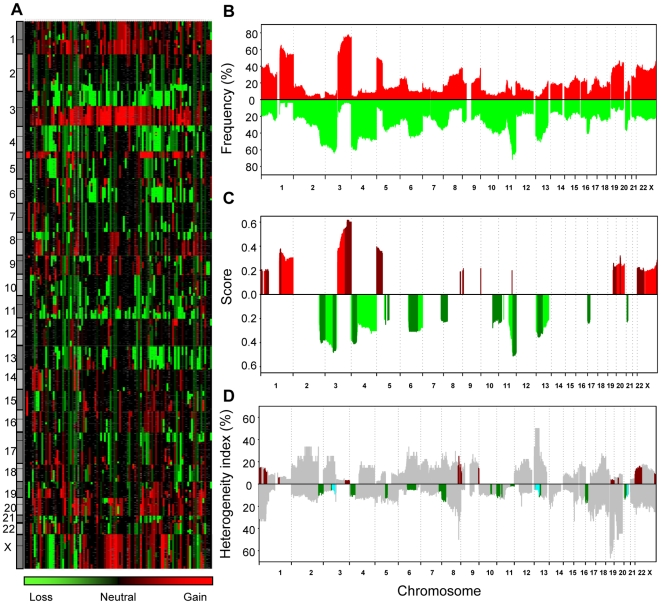
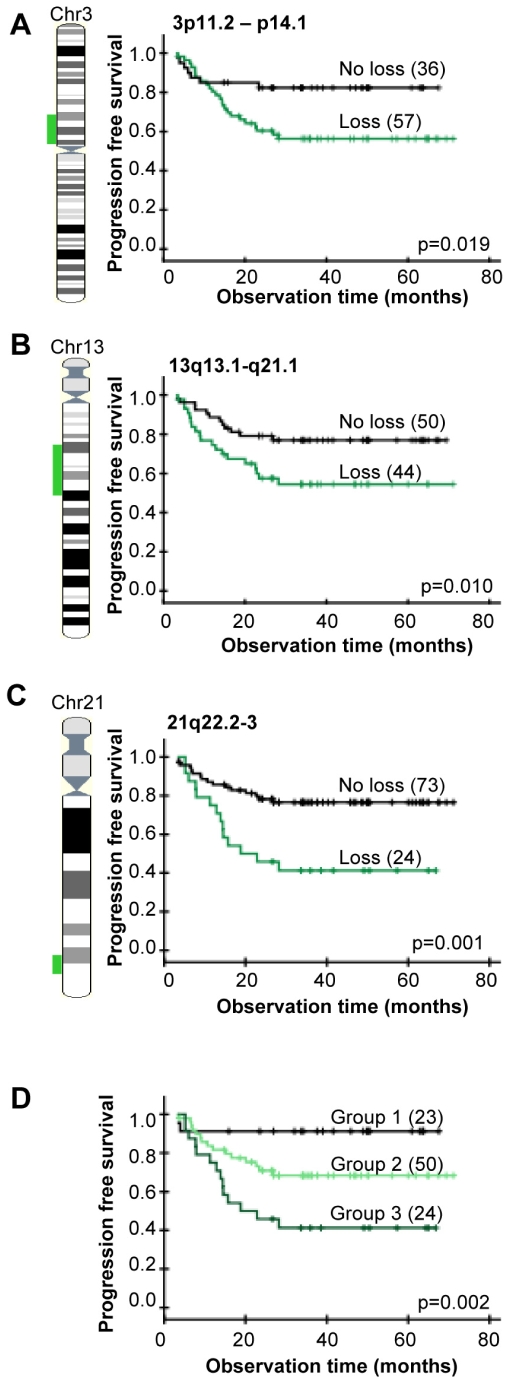
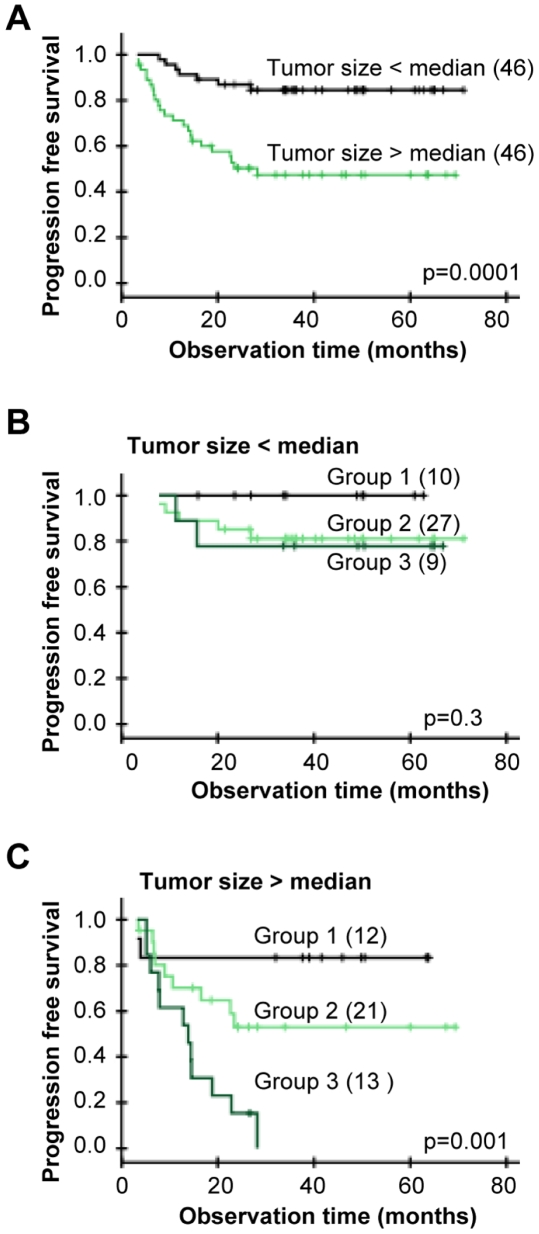
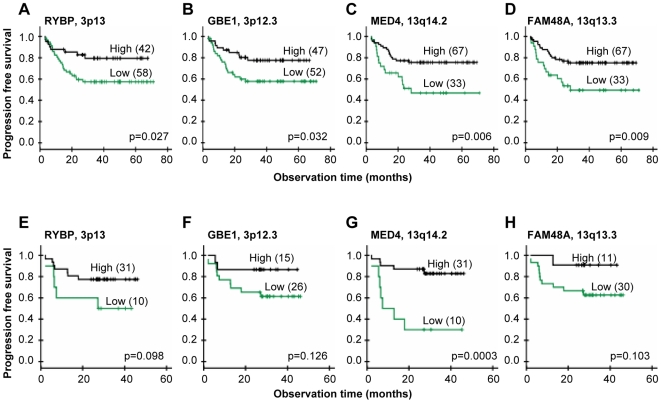
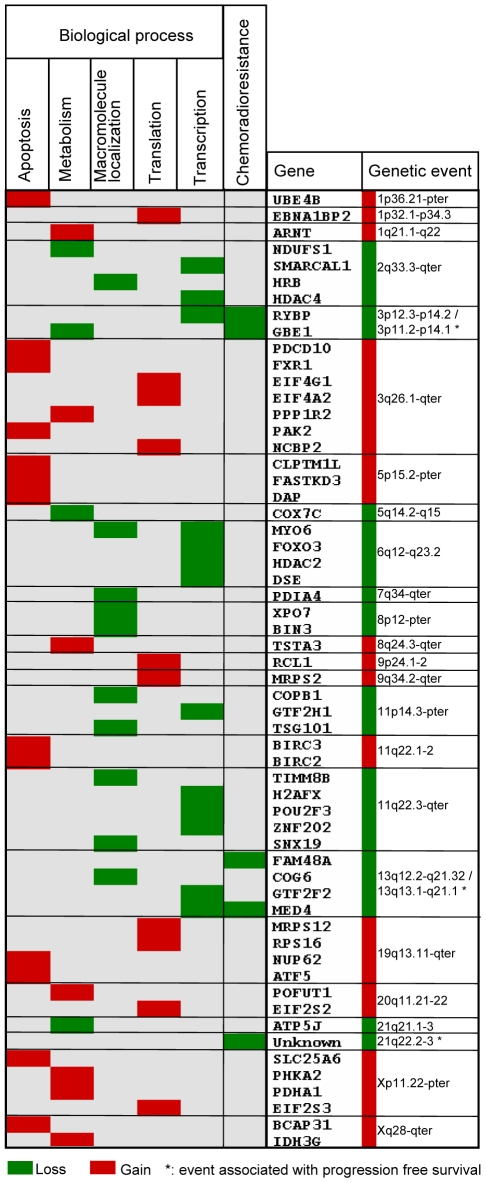
Integrative analysis of gene dosage, expression, and ontology (GO) data was performed to discover driver genes in the carcinogenesis and chemoradioresistance of cervical cancers. Gene dosage and expression profiles of 102 locally advanced cervical cancers were generated by microarray techniques. Fifty-two of these patients were also analyzed with the Illumina expression method to confirm the gene expression results. An independent cohort of 41 patients was used for validation of gene expressions associated with clinical outcome. Statistical analysis identified 29 recurrent gains and losses and 3 losses (on 3p, 13q, 21q) associated with poor outcome after chemoradiotherapy. The intratumor heterogeneity, assessed from the gene dosage profiles, was low for these alterations, showing that they had emerged prior to many other alterations and probably were early events in carcinogenesis. Integration of the alterations with gene expression and GO data identified genes that were regulated by the alterations and revealed five biological processes that were significantly overrepresented among the affected genes: apoptosis, metabolism, macromolecule localization, translation, and transcription. Four genes on 3p (RYBP, GBE1) and 13q (FAM48A, MED4) correlated with outcome at both the gene dosage and expression level and were satisfactorily validated in the independent cohort. These integrated analyses yielded 57 candidate drivers of 24 genetic events, including novel loci responsible for chemoradioresistance. Further mapping of the connections among genetic events, drivers, and biological processes suggested that each individual event stimulates specific processes in carcinogenesis through the coordinated control of multiple genes. The present results may provide novel therapeutic opportunities of both early and advanced stage cervical cancers.


Conflict of interest statement

The authors have declared that no competing interests exist.

Figures

Figure 1
Figure 1. Gene dosage alterations of locally advanced cervical cancers.
(A) Absolute gene dosage profile of 97 patients. Patients are shown in columns and gene dosages are ordered by DNA location in rows. The color scale ranges from green (loss) through black (neutral) to red (gain). Grey indicates missing values. (B) Frequency of patients with gains (red) and losses (green) along chromosome 1 to X for the patients in (A). Gene dosage alterations above 1.1 and below 0.9 were classified as gains and losses, respectively. (C) Score of recurrent gains (red) and losses (green) along chromosome 1 to X for the patients in (A). Peak regions, defined in Table 2, are shown in darker colors. (D) Intratumor heterogeneity in gene dosage alterations along chromosome 1 to X for the patients in (A). The heterogeneity index is shown for gains (above the zero line) and losses (below the zero line) separately, and was calculated as the number of heterogeneous cases relative to the total number of cases with alteration at each DNA location. The peak regions shown in (C) are marked in red (recurrent gains) and green (recurrent losses). The predictive losses are indicated in light blue.
Figure 2
Figure 2. Gene dosage alterations and outcome after chemoradiotherapy.
Kaplan-Meier curves of progression free survival for cervical cancer patients with (green) and without (black) loss of 3p11.2-p14.1 (A), 13q13.1-q21.1 (B), 21q22.2-3 (C), and for patients with different combinations of the three losses (D). P-values in log-rank test and number of patients are indicated. Data of the most significant genomic clone within each region were used; i.e, BAC clone ID RP11-118O11 (3p), RP11-408L13 (13q), and RP1-128M19 (21q). Total number of patients in (A, B) is less than 97 due to missing gene dosage data. (A–C) The lost DNA region is indicated on the chromosome (left). (D) Group 1: patients without loss of 3p11.2-p14.1, 13q13.1-q21.1, or 21q22.2-3, group 2: patients with loss of 3p11.2-p14.1 and/or 13q13.1-q21.1, but not 21q22.2-3, group 3: patients with loss of 21q22.2-3 only or loss of 21q22.2-3 combined with loss of 3p11.2-p14.1 and/or 13q13.1-q21.1. The groups were determined from data of each possible combination of the losses (Figure S3).
Figure 3
Figure 3. Gene dosage alterations and outcome after chemoradiotherapy for patients with different tumor size.
(A) Kaplan-Meier curves of progression free survival for cervical cancer patients with tumor size above (green) and below (black) median. Ninety-two patients with tumor size determined from diagnostic MR images were included. Median size was 45.1 cm3, corresponding to a diameter of 4.4 cm. (B,C) Kaplan-Meier curves for patients in (A) with tumor size below median (B) and above median (C). Group 1: patients without loss of 3p11.2-p14.1, 13q13.1-q21.1, or 21q22.2-3, group 2: patients with loss of 3p11.2-p14.1 and/or 13q13.1-q21.1, but not 21q22.2-3, group 3: patients with loss of 21q22.2-3 only or loss of 21q22.2-3 combined with loss of 3p11.2-p14.1 and/or 13q13.1-q21.1. The groups were determined from data of each possible combination of the losses (Figure S3). P-values in log-rank test and number of patients are indicated.
Figure 4
Figure 4. Gene expressions and outcome after chemoradiotherapy.
Kaplan-Meier curves of progression free survival for cervical cancer patients with low (green) and high (black) expression of RYBP (A,E), GBE1 (B,F), MED4 (C,G), and FAM48A (D,H). cDNA data of 100 patients is used in (A–D), and Illumina data of an independent cohort of 41 patients is used in (E–H) for validation. P-value in log-rank test and number of patients are indicated. The number of patients in each group was chosen to achieve the largest difference in survival between the groups, approximately reflecting the number of patients with and without loss in (A–D). Total number of patients is less than 100 in (B) due to missing gene expression data.
Figure 5
Figure 5. Genetic events, correlating genes, and biological processes in carcinogenesis and chemoradioresistance of cervical cancers.
Recurrent and predictive gene dosage alterations, correlating genes, and biological processes overrepresented among the genes are listed. Only the genetic events associated with a process or chemoradioresistance (*) are included; six of the recurrent alterations are therefore not shown. The genes are ordered by DNA location. Correlating genes connected to chemoradioresistance were associated with clinical outcome both at the gene dosage and expression level and validated in an independent patient cohort. Gains and losses are indicated with red and green color, respectively.

References

    1. Cannistra SA, Niloff JM. Cancer of the uterine cervix. N Engl J Med. 1996;334:1030–1038. - PubMed
    1. Eifel PJ. Concurrent chemotherapy and radiation therapy as the standard of care for cervical cancer. Nat Clin Pract Oncol. 2006;3:248–255. - PubMed
    1. Hanahan D, Weinberg RA. The hallmarks of cancer. Cell. 2000;100:57–70. - PubMed
    1. Kroemer G, Pouyssegur J. Tumor cell metabolism: cancer's Achilles' heel. Cancer Cell. 2008;13:472–482. - PubMed
    1. Mosesson Y, Mills GB, Yarden Y. Derailed endocytosis: an emerging feature of cancer. Nat Rev Cancer. 2008;8:835–850. - PubMed

Publication types