

Optimal experimental design for parameter estimation of a cell signaling model
- PMID: 19911077
- PMCID: PMC2775273
- DOI: 10.1371/journal.pcbi.1000558
Optimal experimental design for parameter estimation of a cell signaling model
Abstract
Differential equation models that describe the dynamic changes of biochemical signaling states are important tools to understand cellular behavior. An essential task in building such representations is to infer the affinities, rate constants, and other parameters of a model from actual measurement data. However, intuitive measurement protocols often fail to generate data that restrict the range of possible parameter values. Here we utilized a numerical method to iteratively design optimal live-cell fluorescence microscopy experiments in order to reveal pharmacological and kinetic parameters of a phosphatidylinositol 3,4,5-trisphosphate (PIP(3)) second messenger signaling process that is deregulated in many tumors. The experimental approach included the activation of endogenous phosphoinositide 3-kinase (PI3K) by chemically induced recruitment of a regulatory peptide, reversible inhibition of PI3K using a kinase inhibitor, and monitoring of the PI3K-mediated production of PIP(3) lipids using the pleckstrin homology (PH) domain of Akt. We found that an intuitively planned and established experimental protocol did not yield data from which relevant parameters could be inferred. Starting from a set of poorly defined model parameters derived from the intuitively planned experiment, we calculated concentration-time profiles for both the inducing and the inhibitory compound that would minimize the predicted uncertainty of parameter estimates. Two cycles of optimization and experimentation were sufficient to narrowly confine the model parameters, with the mean variance of estimates dropping more than sixty-fold. Thus, optimal experimental design proved to be a powerful strategy to minimize the number of experiments needed to infer biological parameters from a cell signaling assay.
Conflict of interest statement
The authors have declared that no competing interests exist.
Figures
 from
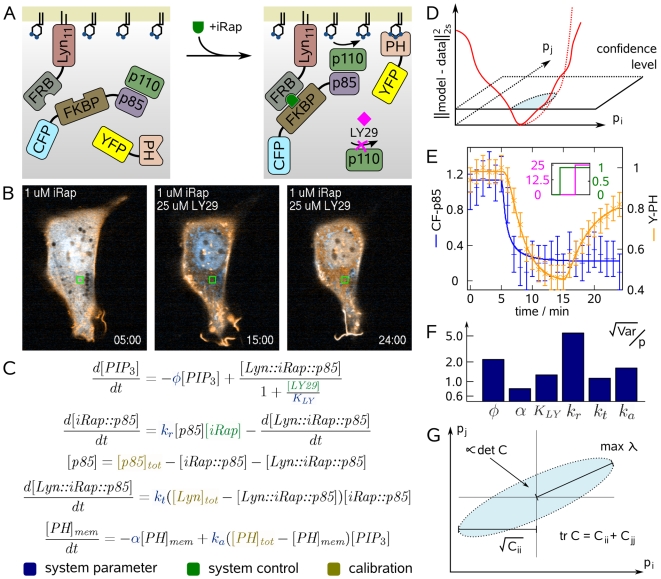
from  . PH domains of many downstream signaling proteins bind to
  enriched membranes with differential affinities. LY29 is a widely used inhibitor of PI3K. (B) Confocal fluorescence images of an NIH 3T3 cell (CF-p85 shown in cyan, Y-PH in yellow). Initially, CF-p85 and Y-PH reside in the cytosol (left). Addition of iRap recruits both constructs to the plasma membrane as can be judged from cytosolic depletion (middle). Y-PH but not CF-p85 dissociates from the plasma membrane upon addition of LY29. Experiment time is shown in minutes. (C) Differential equations model of the dynamic system illustrated in (A). System parameters are shown in blue, variables that allow control of the system are shown in green, and calibration parameters which were different from cell to cell are shown in gold. (D) Parameter values can be inferred by minimizing the discrepancy between model and experimental data. The schematic illustrates this concept for two parameters,
  and
and  . The range of possible parameter values is where this discrepancy falls below the confidence level (blue shaded ellipsoid). If this range is large, parameters can be inferred only with high uncertainty. (E) Fluorescence was quantified in the green square depicted in (B), and the model in (C) was fit to that data. Error bars show data, continuous lines show model output. Blue error bars and lines show cytosolic fluorescence of CF-p85, orange error bars and lines cytosolic fluorescence of Y-PH. (F) The relative uncertainty of parameter estimates was very high. This is a common problem in systems biology models. (G) Schematic projection of the confidence ellipsoid from (D). Good experiments minimize the size of this uncertainty region (shaded blue). Criteria that have been proposed for describing this size are the longest half-axis, the average extent, or the volume of the confidence ellipsoid, among others. These criteria correspond to properties of the parameter covariance matrix
  .
.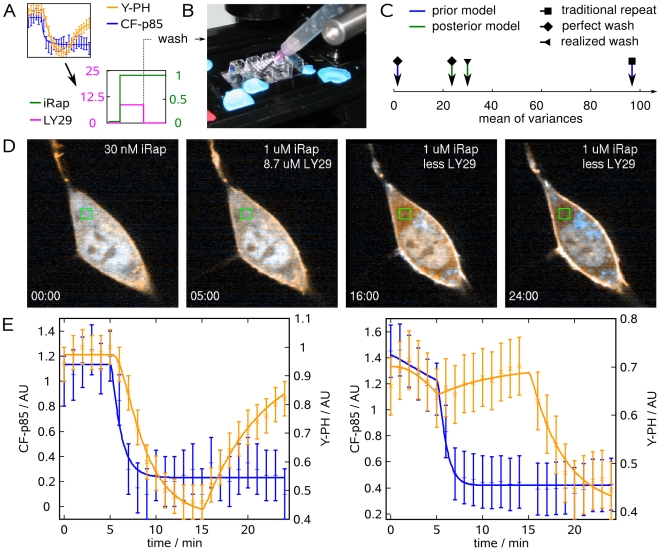
 iRap in extracellular buffer. (C) Mean of parameter variances predicted for or achieved with the optimized experiment. Arrows indicate the parameter variance at different stages of model development, and under consideration of experimental uncertainty introduced by the wash. (D) Confocal fluorescence images of an NIH 3T3 cell (CF-p85 shown in cyan, Y-PH in yellow). 30 nM iRap was added immediately before triggering time-lapse acquisition. After 5 min,
  iRap and
  LY29 were added. 10 min later, LY29 was washed out, using
  iRap in extracellular buffer. Experiment time is shown in minutes. (E) Combined parameter estimation from both the traditional (left) and optimized (right) experiment. Error bars show data, continuous lines show model output. Blue error bars and lines show cytosolic fluorescence of CF-p85, orange error bars and lines cytosolic fluorescence of Y-PH. The frame captured at minute 15 of the optimized experiment was lost to brightfield illumination during the washout procedure.
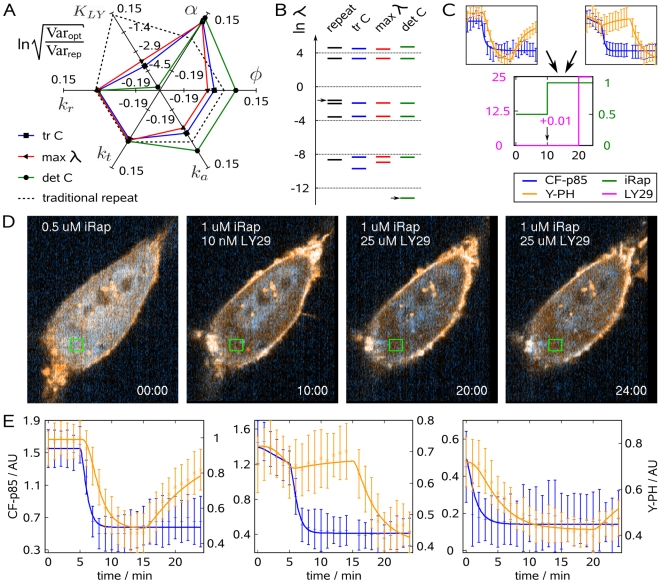
 . (C) Schematic of sequential experimentation. The data from the traditional and the first optimized experiment were used for optimizing the concentration-time profile of iRap (green) and LY29 (pink) for the next experiment. (D) NIH 3T3 cell (CF-p85 shown in cyan, Y-PH in yellow).
  iRap was added at the beginning of the experiment. 10 min later, another 10 nM LY29 and another
  iRap were added. PI3K remained active as judged from low cytosolic fluorescence of Y-PH.
  LY29 was added at minute 20, resulting in dissociation of Y-PH from the plasma membrane. Time is shown in minutes. (E) Combined parameter estimation on all three experiments. Error bars show data, continuous lines show model output. Blue error bars and lines show cytosolic fluorescence of CF-p85, orange ones show cytosolic fluorescence of Y-PH.
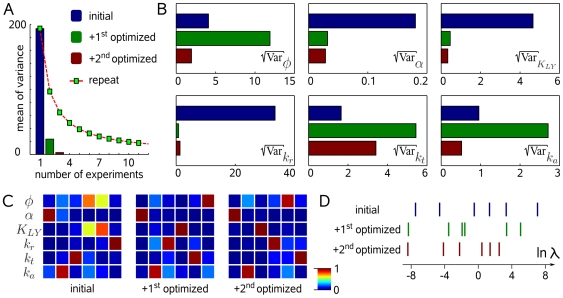
 were consistently reduced.
References
-
- Nelson DE, Ihekwaba AEC, Elliott M, Johnson JR, Gibney CA, et al. Oscillations in NF-κB Signaling Control the Dynamics of Gene Expression. Science. 2004;306:704–708. - PubMed
-
- Fivaz M, Bandara S, Inoue T, Meyer T. Robust neuronal symmetry breaking by Ras-triggered local positive feedback. Curr Biol. 2008;18:44–50. - PubMed
-
- Brown KS, Hill CC, Calero GA, Myers CR, Lee KH, et al. The statistical mechanics of complex signaling networks: nerve growth factor signaling. Phys Biol. 2004;1:184–195. - PubMed
-
- Kitano H. Computational systems biology. Nature. 2002;420:206–210. - PubMed
Publication types
MeSH terms
Substances
Grants and funding
LinkOut - more resources
Full Text Sources
