

Review
doi: 10.1016/j.molonc.2009.10.003.
Epub 2009 Oct 28.
Targeted therapies: the rare cancer paradigm
Affiliations
- PMID: 19913465
- PMCID: PMC5527958
- DOI: 10.1016/j.molonc.2009.10.003
Item in Clipboard
Review
Targeted therapies: the rare cancer paradigm
Mol Oncol.
2010 Feb.
Abstract
This review analyzes the state of the art of targeted therapies for several tumors, starting from the paradigmatic example of Imatinib treatment in chronic myelogenous leukemia (CML). We discuss how rare tumors can be models for various mechanisms of receptor tyrosine kinase (RTK) activation, and provide the opportunity to develop new therapies also for more common cancer types. We discuss the activation of the downstream RTK effectors as further targets for therapies in colorectal cancer. Finally, we highlight how a novel multidimensional approach which adds an in silico dimension to the in vitro and in vivo approach, can predict clinical results.
Figures
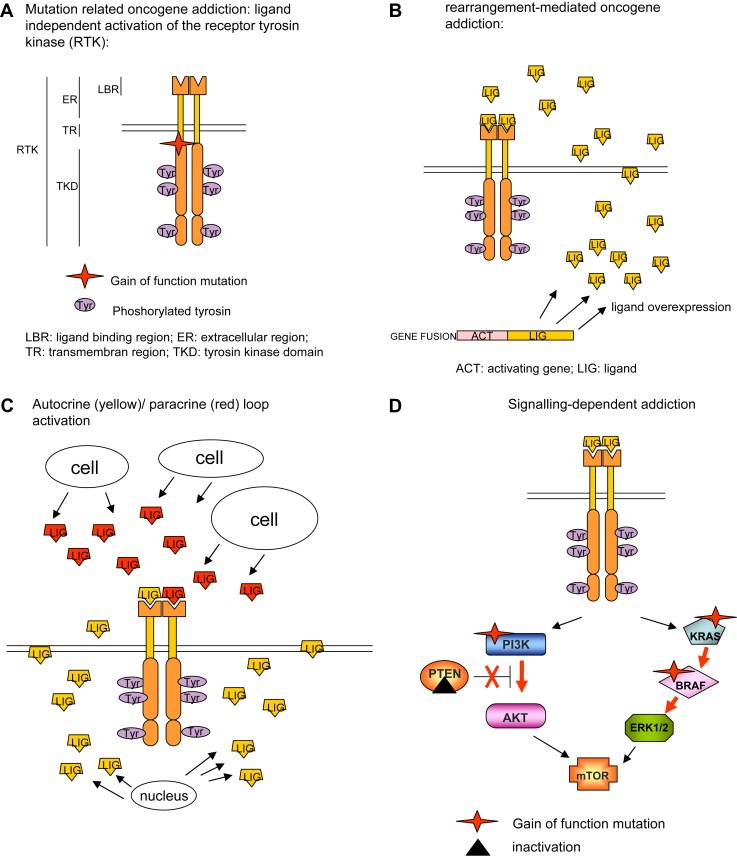
Mechanisms of RTK activation. Gain of function mutation (A); gene translocation (B); autocrine/paracrine loop activation (C); and signalling pathway deregulation related to altered effectors of the RTK pathway (D).
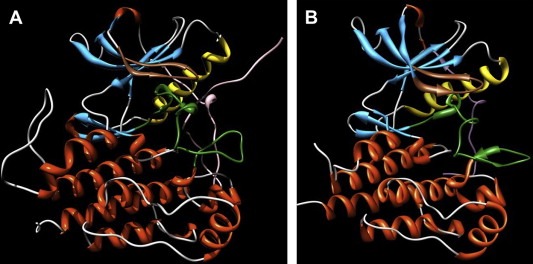
Molecular dynamics simulations. Molecular dynamics simulations snapshots of the three‐dimensional structure of (A) inactive (autoinhibited or “closed”) KIT conformation; and (B) active (“open”) KIT conformation. Secondary structure motifs are colored as follows: light gray, coils; deep sky blue, b‐sheets; orange, a‐helices. The juxtamembrane domain is depicted in plum, the P‐loop is in sienna, the A‐loop in forest green, and the control C‐helix in gold).
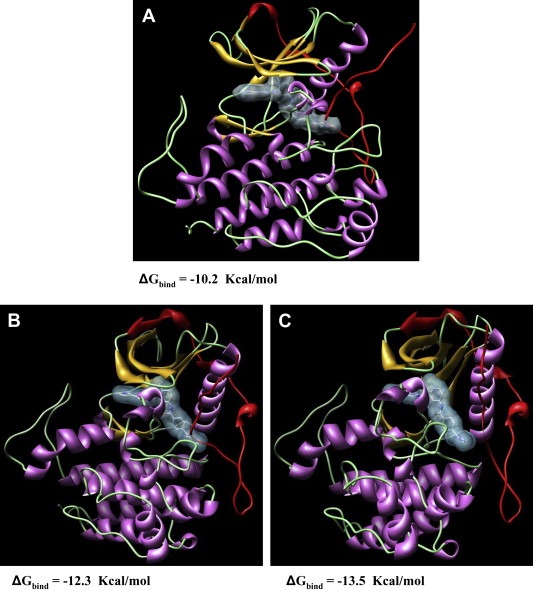
Molecular dynamics simulations. Molecular dynamics simulations snapshots of the three‐dimensional structure of (A) wild‐type KIT; (B) Δ558–559 mutant Kit; and (C) V560G mutant Kit in complex with Imatinib. Secondary structure motifs are colored as follows: light green, coils; gold, b‐sheets; plum, a‐helices. The juxtamembrane domain is depicted in red. Imatinib is in stick representation (atom color code: gray, carbon; red, oxygen, blue, nitrogen), and its molecular surface is highlighted in light blue. Water molecules and hydrogen atoms are omitted for clarity.
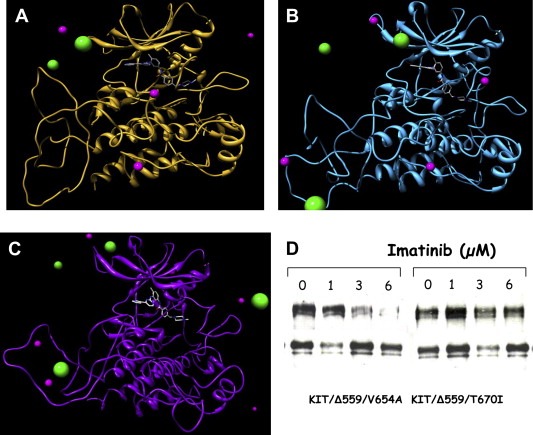
Molecular dynamics simulations. Molecular dynamics simulations snapshots of the three‐dimensional structure of (A) wild‐type KIT; (B) V654A mutant Kit; and (C) T670I mutant Kit in complex with Imatinib. Imatinib is in stick representation (atom color code: gray, carbon; red, oxygen, blue, nitrogen). Some chlorine and sodium counterions are visualized as green and magenta spheres, respectively (sphere size not in scale for graphical purposes). Water molecules and hydrogen atoms are omitted for clarity. Note how Imatinib conformation and position in its binding pocket is notably altered in the presence of the T670I mutation (C), while its structure and the whole pocket conformation is less perturbed in the V654A mutant kinase (B) with respect to the wild‐type counterpart. (D) Biochemical analysis of the two mutants showing the different sensitivity to Imatinib. The activated KIT carrying the substitution V654A is inhibited by a 6μM of Imatinib while the one carrying the T670I does not.
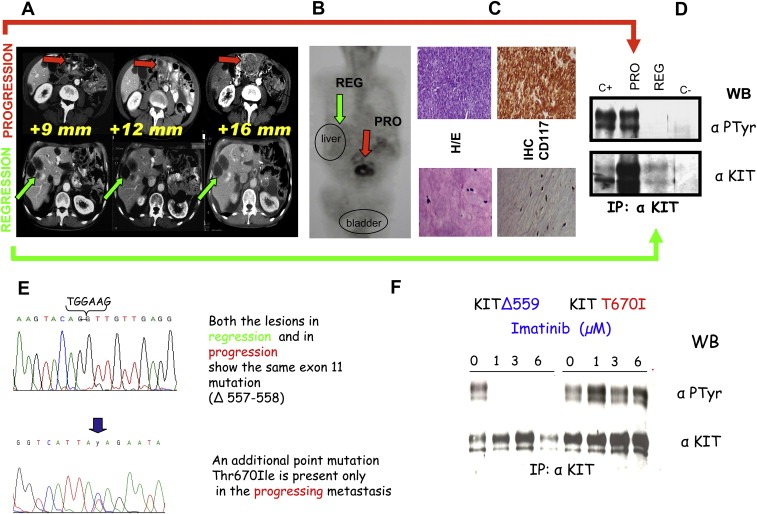
Clinical, pathological (biochemical and molecular) characterizations of GIST patients. A. CT scan of a male, 65year old patient who was operated on for a peritoneal mass (measuring 22cm) 2years previously. The diagnosis indicated a high grade GIST. He started Imatinib treatment at 800mg/day, with radiological follow‐up every 3months. In the upper lane, indicated by red arrows, the peritoneal progressing lesion is highlighted. In the lower lane, indicated by green arrows, the responding liver lesions are shown. These lesions were classified as responding due to their “hypodense” appearance. B. PET analysis. Glucose uptake, indicating a proliferating mass, is detectable only at peritoneal rather than liver site. C. Histopathological evaluation of the lesions after surgical removal. The non‐responding tumor, upper lane, nodule showed a highly cellular appearance. The tightly packed tumoral cells were arranged into large sheets of small acinus‐like clusters deposited in a myxoid stroma. The responding liver lesion, lower lane, showed marked cellular depletion. CD117 immunostaining was evidenced only in the progressing lesion. D. Biochemical analysis (immunoprecipitation of 0.5 mg of total proteins extract) of the above described lesions. A phosphorylated (active) and highly expressed KIT receptor was present in the progressing lesion and not in the responding one. E. DNA sequencing revealed in both lesions the activating exon 11 point mutation corresponding to the loss of 557–558 residues. Only in the progressing lesion an additional point mutation affecting exon 14 was present leading to the substitution T670I. F. “In vitro” analysis of COS cells, transfected with an expressing vector for KIT receptor in which was inserted the T670I substitution. Different doses of Imatinib were given and, as can be seen in the right part of the panel, T670I/KIT showed phosphorylation (activation) at all concentrations of the drug, while KIT carrying exon 11 mutation was inhibited at 1μM Imatinib.
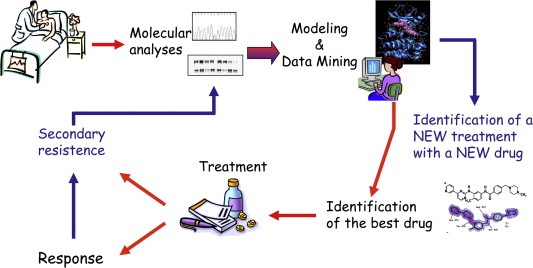
Efficacy of a personalized therapy from bed to bench and back. The route moves from the primary tumor molecular profile of the patient to the modeling of the molecular target and the examination of its data, the identification of the best available drug, the evaluation of clinic response and the possibility, even in the presence of relapse and thus of resistance to the treatment, to restart along this virtuous circle moving from the molecular profiling of the reactivated tumor which developed a secondary resistance, to new modeling and data mining which in turn lead to designing a new treatment with a new drug.
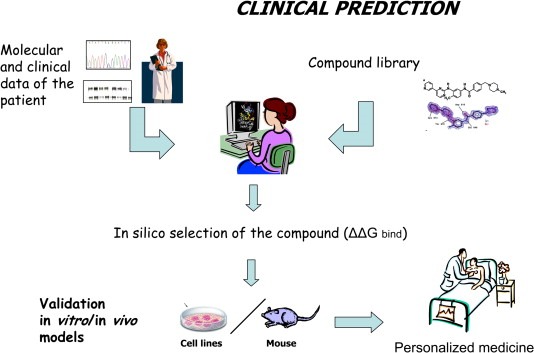
Clinical prediction. Starting from a 3D model of the target molecule (e.g. RTK) according to its molecular status detected in the tumor and patient clinical information, an “in silico” selection of the best drug in terms of binding energy could be performed using a collection of compounds (library). Only the drugs which passed this preliminary selection will undergo the usual validation “in vitro” and “in vivo” tests in order to design a truly personalised treatment.
References
-
- Argani, P. , Antonescu, C.R. , Illei, P.B. , Lui, M.Y. , Timmons, C.F. , Newbury, R. , Reuter, V.E. , Garvin, A.J. , Perez-Atayde, A.R. , Fletcher, J.A. , Beckwith, J.B. , Bridge, J.A. , Ladanyi, M. , 2001. Primary renal neoplasms with the ASPL-TFE3 gene fusion of alveolar soft part sarcoma: a distinctive tumor entity previously included among renal cell carcinomas of children and adolescents. Am. J. Pathol. 159, (1) 179–192. - PMC - PubMed
-
- Argani, P. , Lal, P. , Hutchinson, B. , Lui, M.Y. , Reuter, V.E. , Ladanyi, M. , 2003. Aberrant nuclear immunoreactivity for TFE3 in neoplasms with TFE3 gene fusions: a sensitive and specific immunohistochemical assay. Am. J. Surg. Pathol. 27, (6) 750–761. - PubMed
-
- Aubin, J.E. , Bonnelye, E. , 2000 Mar. Osteoprotegerin and its ligand: a new paradigm for regulation of osteoclastogenesis and bone resorption. Medscape Womens Health. 5, (2) 5 - PubMed
-
- Azizi, A.A. , Haberler, C. , Czech, T. , Gupper, A. , Prayer, D. , Breitschopf, H. , Acker, T. , Slavc, I. , 2006. Vascular-endothelial-growth-factor (VEGF) expression and possible response to angiogenesis inhibitor bevacizumab in metastatic alveolar soft part sarcoma. Lancet Oncol. 7, 533–535. - PubMed
Publication types
MeSH terms
Substances
LinkOut - more resources
Full Text Sources
Medical
