

Review
doi: 10.1016/j.febslet.2009.11.021.
The molecular clockwork of a protein-based circadian oscillator
Affiliations
- PMID: 19913541
- PMCID: PMC2810098
- DOI: 10.1016/j.febslet.2009.11.021
Item in Clipboard
Review
The molecular clockwork of a protein-based circadian oscillator
FEBS Lett.
.
Abstract
The circadian clock of the cyanobacterium Synechococcus elongatus PCC 7942 is governed by a core oscillator consisting of the proteins KaiA, KaiB, and KaiC. Remarkably, circadian oscillations in the phosphorylation state of KaiC can be reconstituted in a test tube by mixing the three Kai proteins and adenosine triphosphate. The in vitro oscillator provides a well-defined system in which experiments can be combined with mathematical analysis to understand the mechanism of a highly robust biological oscillator. In this Review, we summarize the biochemistry of the Kai proteins and examine models that have been proposed to explain how oscillations emerge from the properties of the oscillator's constituents.
Figures
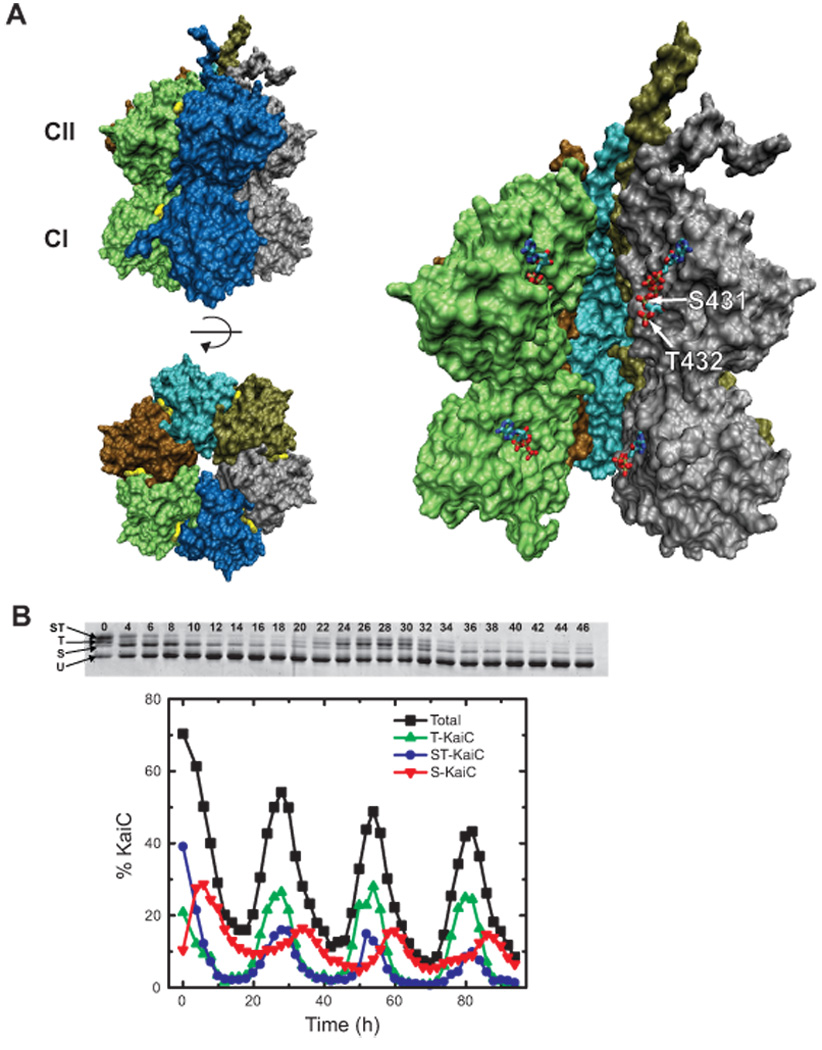
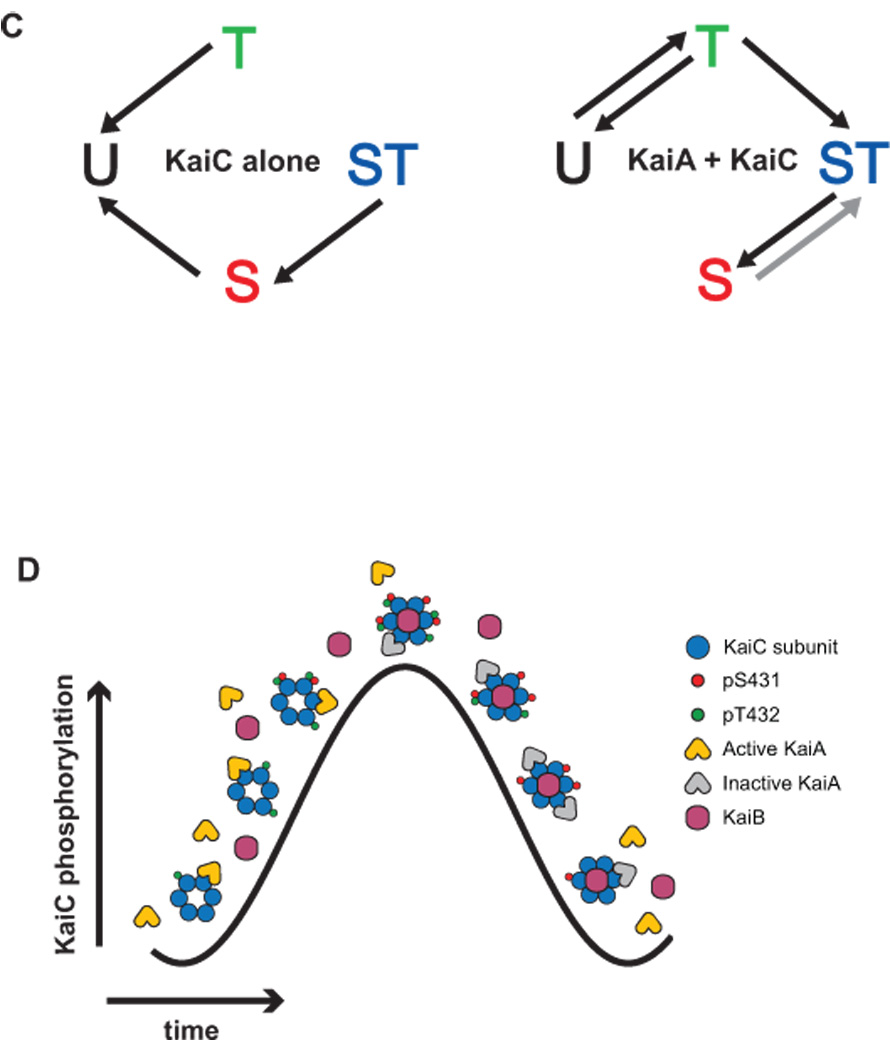
(A) The structure of KaiC (PDB 2GBL). (Upper left) The surface of a KaiC hexamer viewed from the side of the double-doughnut-shaped multimer. Each subunit is shown in a different color. ATP molecules bound at the interface between adjacent subunits are shown in yellow; only the edge of the adenine base is visible, with the remainder of the nucleotide buried in the subunit-subunit interface. (Lower left) The top of the KaiC hexamer, viewed from the CII side, with the C-terminal tails (residues beyond 497) omitted for clarity. This view is obtained by rotating upper left view by 90°C out of the plane of the page. (Right) Cutaway view showing the locations of the ATPs and the two phosphorylation sites at the subunit-subunit interface. Chain E has been removed to reveal the buried ATP and phosphorylation sites. The ATP molecules, phosphorylated S431 (chain F), and phosphorylated T432 (chain F) are highlighted Figures were rendered using VMD [59]. (B) Rhythmic phosphorylation of KaiC in a KaiA-KaiB-KaiC reaction. (Top) Image of an SDS-PAGE gel used to resolve the four phosphoforms of KaiC. The time in hours at which each sample was acquired is indicated; the three proteins were mixed and placed at 30 °C at time zero. (Bottom) Quantification of the KaiC phosphoform distribution as a function of time. U-KaiC, unphosphorylated KaiC; T-KaiC, KaiC phosphorylated only on T432; S-KaiC, KaiC phosphorylated only on S431; ST-KaiC, KaiC phosphorylated on both S431 and T432; Total, percentage of KaiC phosphorylated at either or both residues (S-KaiC + T-KaiC + ST-KaiC). (C) Diagram showing the major KaiC autokinase and autophosphatase reactions that occur in the presence or absence of KaiA, according to Rust et al [36] and Nishiwaki et al [37]. In the fitted rate constants obtained by Rust et al [36], the rate constant for the dephosphorylation of ST-KaiC to T-KaiC was nonzero, but we now believe that this is a fitting artifact and that the rate constant is, in fact, negligible, consistent with the phosphomimetic data of Nishiwaki et al; therefore, we do not show an arrow from ST-KaiC to T-KaiC. The arrow denoting the phosphorylation of S-KaiC to produce ST-KaiC is colored gray to indicate the disagreement between the results of Rust et al [36] (which suggest that the process occurs at an appreciable rate) and those of Nishiwaki et al [37] (which suggest that the process does not occur). As the rate at which S-KaiC can be phosphorylated to yield ST-KaiC in the presence of KaiA plays an important role in the model of Rust et al, it is important to further investigate whether this process occurs. (D) A schematic showing key Kai protein complexes that appear during a circadian cycle. KaiA symbols represent dimers, while KaiB symbols represent either dimers or tetramers. At any point in time, the composition of Kai protein complexes is heterogeneous, and a large fraction of KaiC is not bound by KaiA or KaiB; here, only a single complex is shown at each time point to emphasize when key complexes appear. The precise stoichiometries of the various Kai protein complexes remain uncertain, and we have selected arbitrarily a few possible stoichiometries. Also, while phosphorylated S431 (pS431) and phosphorylated T432 (pT432) are located at the interface between subunits (see Figure 1A), here we show them on the outer surface of the subunits for clarity. Active KaiA shuttles amongst KaiC hexamers in the phosphorylation phase, promoting ordered KaiC phosphorylation. KaiB binds primarily to S-KaiC (which appears through dephosphorylation of ST-KaiC), but also may bind to ST-KaiC. Bound KaiB inactivates KaiA, possibly through the formation of KaiA-KaiB-KaiC ternary complexes, which accumulate as S-KaiC levels rise during the mid-dephosphorylation phase through decay of the ST-KaiC reservoir. As levels of S-KaiC themselves decay through dephosphorylation, KaiB binding – and hence KaiA inhibition – is relieved, releasing active KaiA to begin the phosphorylation cycle anew.
(A) The structure of KaiC (PDB 2GBL). (Upper left) The surface of a KaiC hexamer viewed from the side of the double-doughnut-shaped multimer. Each subunit is shown in a different color. ATP molecules bound at the interface between adjacent subunits are shown in yellow; only the edge of the adenine base is visible, with the remainder of the nucleotide buried in the subunit-subunit interface. (Lower left) The top of the KaiC hexamer, viewed from the CII side, with the C-terminal tails (residues beyond 497) omitted for clarity. This view is obtained by rotating upper left view by 90°C out of the plane of the page. (Right) Cutaway view showing the locations of the ATPs and the two phosphorylation sites at the subunit-subunit interface. Chain E has been removed to reveal the buried ATP and phosphorylation sites. The ATP molecules, phosphorylated S431 (chain F), and phosphorylated T432 (chain F) are highlighted Figures were rendered using VMD [59]. (B) Rhythmic phosphorylation of KaiC in a KaiA-KaiB-KaiC reaction. (Top) Image of an SDS-PAGE gel used to resolve the four phosphoforms of KaiC. The time in hours at which each sample was acquired is indicated; the three proteins were mixed and placed at 30 °C at time zero. (Bottom) Quantification of the KaiC phosphoform distribution as a function of time. U-KaiC, unphosphorylated KaiC; T-KaiC, KaiC phosphorylated only on T432; S-KaiC, KaiC phosphorylated only on S431; ST-KaiC, KaiC phosphorylated on both S431 and T432; Total, percentage of KaiC phosphorylated at either or both residues (S-KaiC + T-KaiC + ST-KaiC). (C) Diagram showing the major KaiC autokinase and autophosphatase reactions that occur in the presence or absence of KaiA, according to Rust et al [36] and Nishiwaki et al [37]. In the fitted rate constants obtained by Rust et al [36], the rate constant for the dephosphorylation of ST-KaiC to T-KaiC was nonzero, but we now believe that this is a fitting artifact and that the rate constant is, in fact, negligible, consistent with the phosphomimetic data of Nishiwaki et al; therefore, we do not show an arrow from ST-KaiC to T-KaiC. The arrow denoting the phosphorylation of S-KaiC to produce ST-KaiC is colored gray to indicate the disagreement between the results of Rust et al [36] (which suggest that the process occurs at an appreciable rate) and those of Nishiwaki et al [37] (which suggest that the process does not occur). As the rate at which S-KaiC can be phosphorylated to yield ST-KaiC in the presence of KaiA plays an important role in the model of Rust et al, it is important to further investigate whether this process occurs. (D) A schematic showing key Kai protein complexes that appear during a circadian cycle. KaiA symbols represent dimers, while KaiB symbols represent either dimers or tetramers. At any point in time, the composition of Kai protein complexes is heterogeneous, and a large fraction of KaiC is not bound by KaiA or KaiB; here, only a single complex is shown at each time point to emphasize when key complexes appear. The precise stoichiometries of the various Kai protein complexes remain uncertain, and we have selected arbitrarily a few possible stoichiometries. Also, while phosphorylated S431 (pS431) and phosphorylated T432 (pT432) are located at the interface between subunits (see Figure 1A), here we show them on the outer surface of the subunits for clarity. Active KaiA shuttles amongst KaiC hexamers in the phosphorylation phase, promoting ordered KaiC phosphorylation. KaiB binds primarily to S-KaiC (which appears through dephosphorylation of ST-KaiC), but also may bind to ST-KaiC. Bound KaiB inactivates KaiA, possibly through the formation of KaiA-KaiB-KaiC ternary complexes, which accumulate as S-KaiC levels rise during the mid-dephosphorylation phase through decay of the ST-KaiC reservoir. As levels of S-KaiC themselves decay through dephosphorylation, KaiB binding – and hence KaiA inhibition – is relieved, releasing active KaiA to begin the phosphorylation cycle anew.
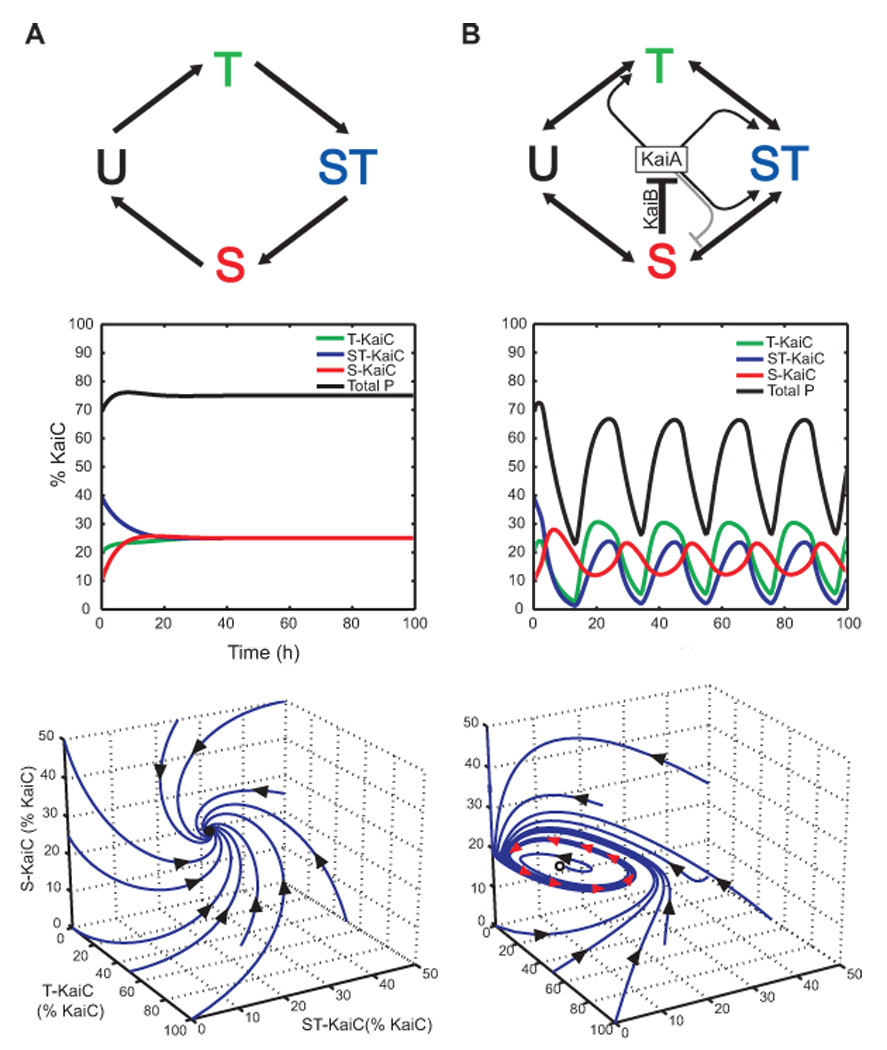
(A) Top, A hypothetical cyclic reaction scheme for KaiA- and KaiB-independent KaiC phosphorylation and dephosphorylation that does not generate oscillations. Middle, Timecourse of phosphoform abundance with all phosphoform interconversions modeled as first-order reactions with rate constants of 0.116 h−1. Bottom, Trajectories of the system starting with various initial conditions; black arrows denote directionality of the trajectories. Notice that all trajectories spiral into a stable fixed point, marked with a solid black circle. (B) Top, Diagram of the model proposed by Rust et al [36] for limit cycle oscillations of the Kai oscillator. Lines emanating from KaiA ending in an arrowhead (black) or bar (gray) indicate stimulation or repression, respectively, of the transition toward the indicated form of KaiC; only the dominant effects of KaiA are shown. S-KaiC inactivates KaiA via KaiB. Figure is from Rust et al, Science 318: 809–812 (2007). Reprinted with permission from AAAS. Middle, Timecourse of phosphoform abundance modeled using the same rate constants employed in Figure 4B of Rust et al [36]. Bottom, Trajectories of the system starting with various initial conditions; black arrows denote directionality of the trajectories. Notice that all trajectories, regardless of initial conditions, approach the limit cycle, which is indicated by red arrows.
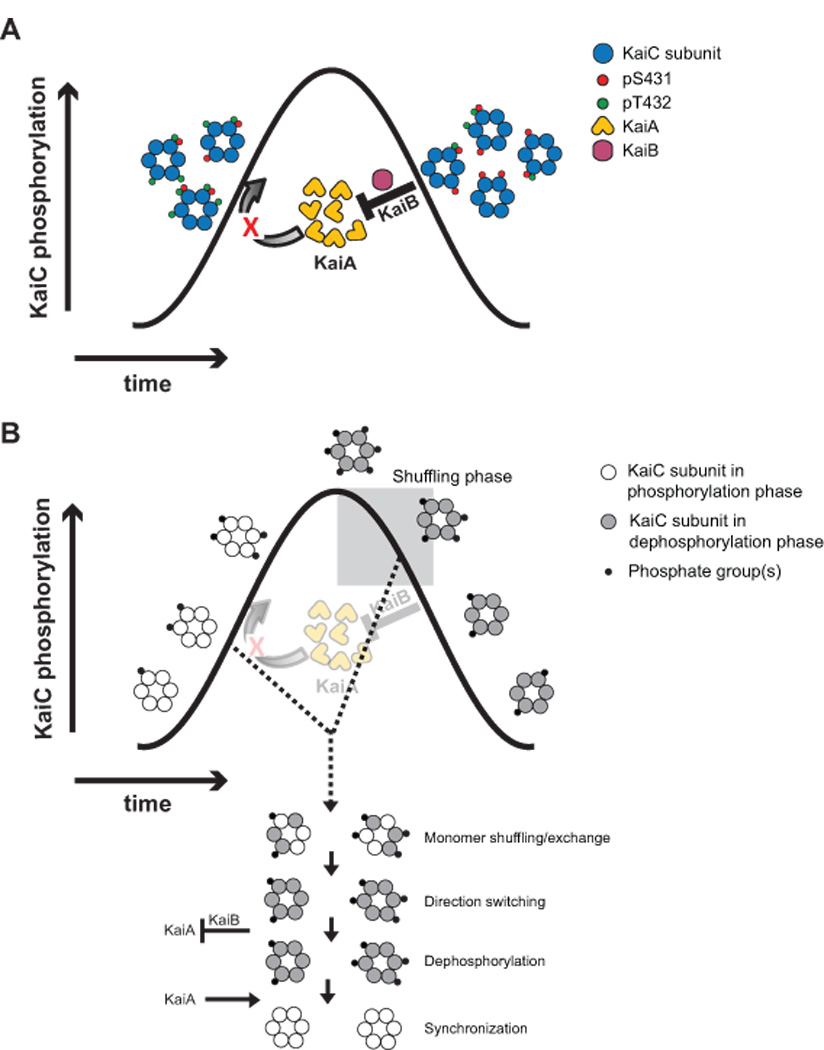
(A) Synchronization through stoichiometric control of KaiA activity by differential inhibition by KaiB and KaiC. Shown is a schematic demonstrating how the global inhibition of KaiA activity by S-KaiC (via KaiB) prevents the phosphorylation of all KaiC hexamers in the reaction, according to the model of Rust et al [36]. Any hexamers with a phosphoform composition typical of the phosphorylation phase begin to dephosphorylate as a result of the loss of KaiA activity. (B) Synchronization through direct interhexamer communication via monomer exchange/shuffling. Shown is the scheme described by Ito et al [14] in which synchronization is effected through forced monomer exchange between phosphorylating KaiC and a special, dominant form of dephosphorylating KaiC that appears in the early dephosphorylation phase (grey box). Inhibition of KaiA by dephosphorylating KaiC (via KaiB), and the release of that inhibition following dephosphorylation, also plays a role in maintaining synchrony. Adapted from ref. [14] by permission from Macmillan Publishers Ltd: Nature Structural and Molecular Biology, copyright 2007.
References
-
- Dunlap JC, Loros JJ, DeCoursey PJ. Chronobiology: biological timekeeping. Sunderland, MA: Sinauer Associates; 2004.
-
- Tomita J, Nakajima M, Kondo T, Iwasaki H. No transcription-translation feedback in circadian rhythm of KaiC phosphorylation. Science. 2005;307:251–254. - PubMed
Publication types
MeSH terms
Substances
Grants and funding
LinkOut - more resources
Full Text Sources
