. 2010 Apr;48(4):582-90.
doi: 10.1016/j.yjmcc.2009.10.033. Epub 2009 Nov 11.

Mice over-expressing the myocardial creatine transporter develop progressive heart failure and show decreased glycolytic capacity

Affiliations

Mice over-expressing the myocardial creatine transporter develop progressive heart failure and show decreased glycolytic capacity

Darci Phillips et al. J Mol Cell Cardiol. 2010 Apr.

Abstract

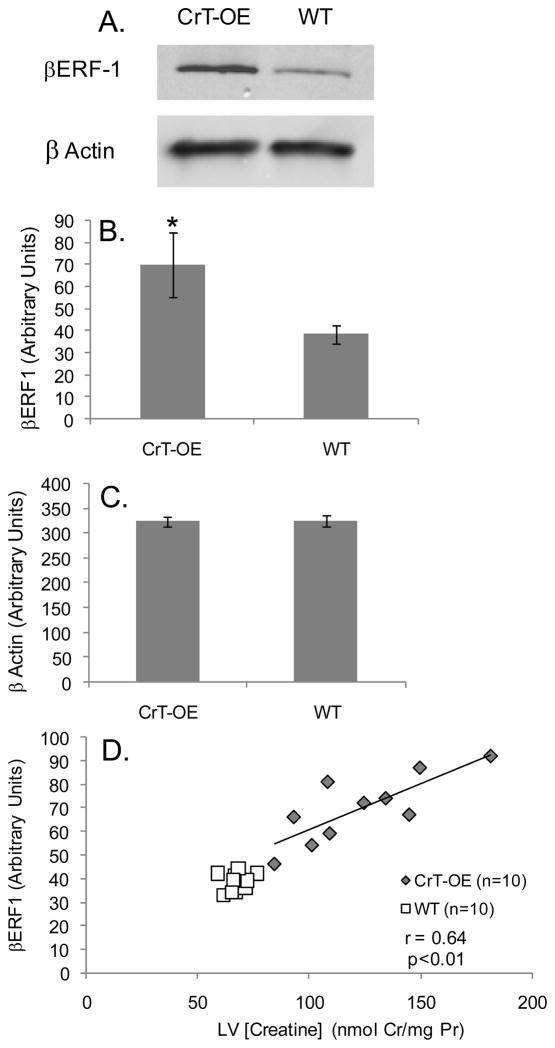
The metabolic phenotype of the failing heart includes a decrease in phosphocreatine and total creatine concentration [Cr], potentially contributing to contractile dysfunction. Surprisingly, in 32- week-old mice over-expressing the myocardial creatine transporter (CrT-OE), we previously demonstrated that elevated [Cr] correlates with left ventricular (LV) hypertrophy and failure. The aim of this study was to determine the temporal relationship between elevated [Cr] and the onset of cardiac dysfunction and to screen for potential molecular mechanisms. CrT-OE mice were compared with wild-type (WT) littermate controls longitudinally using cine-MRI to measure cardiac function and single-voxel (1)H-MRS to measure [Cr] in vivo at 6, 16, 32, and 52 weeks of age. CrT-OE mice had elevated [Cr] at 6 weeks (mean 1.9-fold), which remained constant throughout life. Despite this increased [Cr], LV dysfunction was not apparent until 16 weeks and became more pronounced with age. Additionally, LV tissue from 12 to 14 week old CrT-OE mice was compared to WT using 2D difference in-gel electrophoresis (DIGE). These analyses detected a majority of the heart's metabolic enzymes and identified seven proteins that were differentially expressed between groups. The most pronounced protein changes were related to energy metabolism: alpha- and beta-enolase were selectively decreased (p<0.05), while the remaining enzymes of glycolysis were unchanged. Consistent with a decrease in enolase content, its activity was significantly lower in CrT-OE hearts (in WT, 0.59+/-0.02 micromol ATP produced/microg protein/min; CrT-OE, 0.31+/-0.06; p<0.01). Additionally, anaerobic lactate production was decreased in CrT-OE mice (in WT, 102+/-3 micromol/g wet myocardium; CrT-OE, 78+/-13; p=0.02), consistent with decreased glycolytic capacity. Finally, we found that enolase may be regulated by increased expression of the beta-enolase repressor transcription factor, which was significantly increased in CrT-OE hearts. This study demonstrates that chronically increased myocardial [Cr] in the CrT-OE model leads to the development of progressive hypertrophy and heart failure, which may be mediated by a compromise in glycolytic capacity at the level of enolase.


Figures

Figure 1
Figure 1
1H-MR spectra and creatine contents from wild-type and CrT-OE mice. Representative 1H-MR spectra from a wild-type (A) and a CrT-OE (B) mouse, obtained from a 2 μl voxel placed in the inter-ventricular septum. The arrow indicates the supra-normal creatine level (CH3-resonance of a creatine at 3 ppm). Creatine content was measured using 1H-MRS at 6 weeks, 16 weeks, 32 weeks, and 52 weeks and by HPLC at 52 weeks (C). * denotes a p-value less than 0.05 for wild-type versus CrT-OE at each time-point. No significant difference was observed for creatine content across the 52 weeks of this study.
Figure 2
Figure 2
Cine-MR images and function information for wild-type and CrT-OE hearts. Panel A shows in vivo short-axis cine-MR images from a wild-type mouse at end diastole (upper left) and end systole (lower left), and from a CrT-OE mouse at end diastole (upper right) and end systole (lower right) at 32 weeks of age. The white bar is equal to 2 mm. Panel B shows the LV ejection fraction for wild-type and CrT-OE mice over the 52 week study period. * denotes a p-value less than 0.05 for wild-type vs CrT-OE (i.e., between groups) and # denotes a p-value less than 0.05 when comparing all parameters over time (i.e., within groups).
Figure 3
Figure 3
Correlation of myocardial creatine content and cardiac function in CrT-OE mice. Graph A correlates the mean myocardial creatine content over 52 weeks with the ejection fraction at 52 weeks. Graph B correlates the myocardial creatine content at 6 weeks with the decline in ejection fraction from 6 weeks to 52 weeks.
Figure 4
Figure 4
Proteomics comparison of LV tissue from a wild-type and CrT-OE heart. Panel A shows a representative 2D DIGE image comparing wild-type (labeled red, Cy3) and CrT-OE (labeled green, Cy5) myocardial protein profiles. Proteins are separated in the horizontal direction by isoelectric focusing point from pH ~3 to 10, and vertically by molecular weight from ~150 to 10kD. Panel B shows a magnification of the changes to β-enolase and α-enolase. In addition to a decrease in enolase content in CrT-OE hearts, protein elements of both β-enolase and α-enolase undergo acidic isoelectric shifts, which suggest that a post-translational modification may be acting on these proteins.
Figure 5
Figure 5
Measurement of enolase activity in wild-type, CrT-OE, sham control, and aortic banded (hypertrophied) hearts. Panel A shows that the rate of ATP produced (which in this assay is directly proportional to enolase activity) is significantly suppressed in CrT-OE hearts relative to wild-type and in aortic banded hearts relative to sham controls, where * and # denote p-values less than 0.01 and 0.05, respectively. Panel B correlates enolase activity with myocardial creatine content.
Figure 6
Figure 6
Measurement of glycolytic capacity in wild-type and CrT-OE hearts. Panel A demonstrates that the rate of lactate production via anaerobic glycolysis was decreased in CrT-OE heart extracts relative to wild-type controls, where # denotes a p-value less than 0.05. Panel B correlates lactate production with myocardial creatine content.
Figure 7
Figure 7
Western blot analysis of β-enolase repressor factor 1 for wild-type and CrT-OE hearts. Panel A shows that β-enolase repressor factor 1 is increased in CrT-OE hearts relative to wild-type controls. This example shows a representative Western blot of β-enolase repressor factor 1 (89 kDa) and β actin (43 kDa) in a WT and CrT-OE mouse with high myocardial creatine levels (i.e., above 130 nmol creatine per mg protein). Panel B and Panel C respectively display the β-enolase repressor factor 1 and β actin results quantitatively for 10 WT and 10 CrT-OE hearts, where * denotes a p-value less than 0.01. Panel D correlates β-enolase repressor factor 1 expression with myocardial creatine content.

Similar articles

Cited by

References

    1. Hermann G, Decherd GM. The chemical nature of heart failure. Ann Intern Med. 1939;12:1233–44.
    1. Neubauer S. The failing heart--an engine out of fuel. N Engl J Med. 2007;356:1140–51. - PubMed
    1. OLSON RE, SCHWARTZ WB. Myocardial metabolism in congestive heart failure. Medicine (Baltimore) 1951;30:21–41. - PubMed
    1. Ashrafian H, Frenneaux MP, Opie LH. Metabolic mechanisms in heart failure. Circulation. 2007;116:434–48. - PubMed
    1. Ingwall JS, Weiss RG. Is the failing heart energy starved? On using chemical energy to support cardiac function. Circ Res. 2004;95:135–45. - PubMed

Publication types