. 2010 Feb 1;49(3):2638-48.
doi: 10.1016/j.neuroimage.2009.11.008. Epub 2009 Nov 12.

When less is more: TPJ and default network deactivation during encoding predicts working memory performance

Affiliations

When less is more: TPJ and default network deactivation during encoding predicts working memory performance

Alan Anticevic et al. Neuroimage. .

Abstract

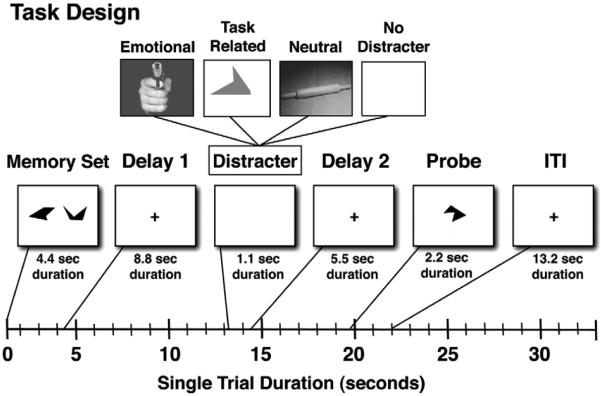
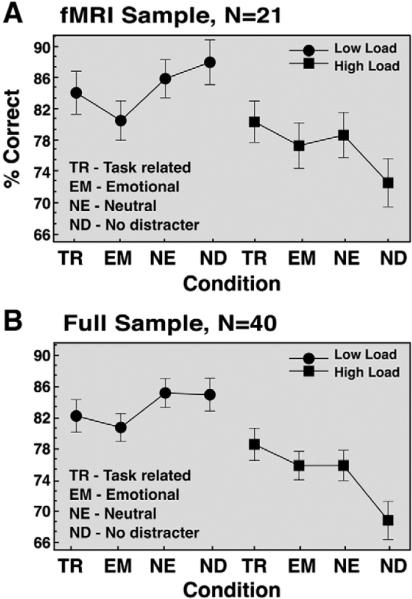
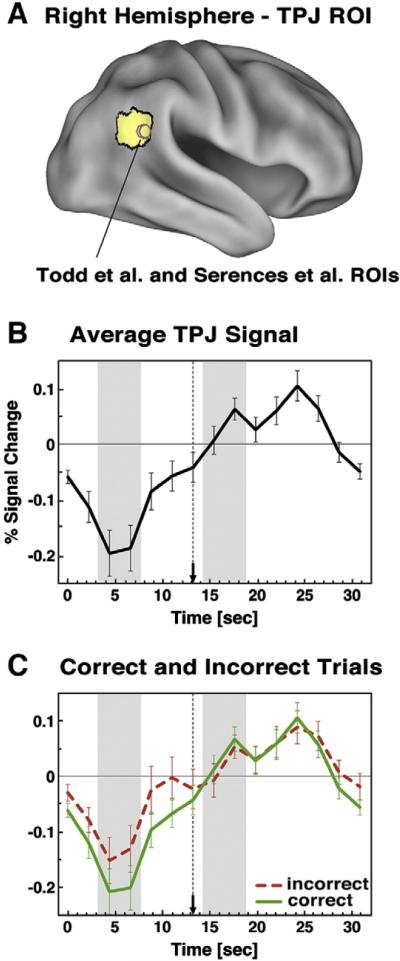
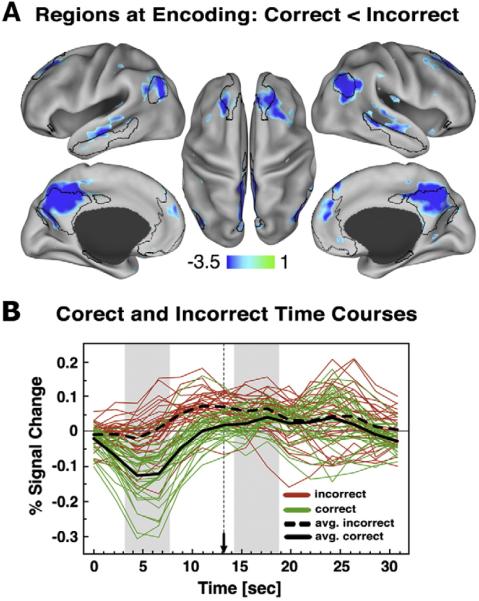
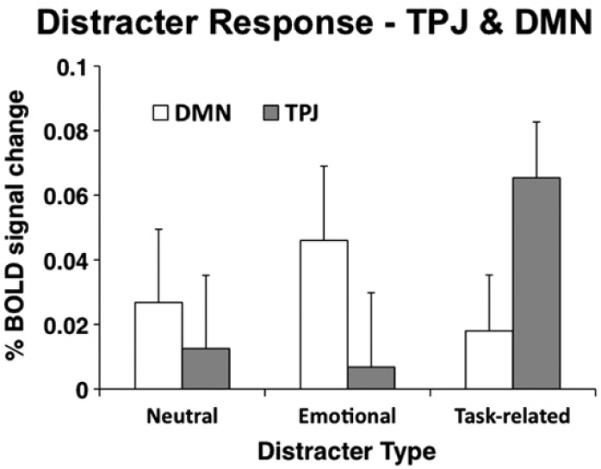
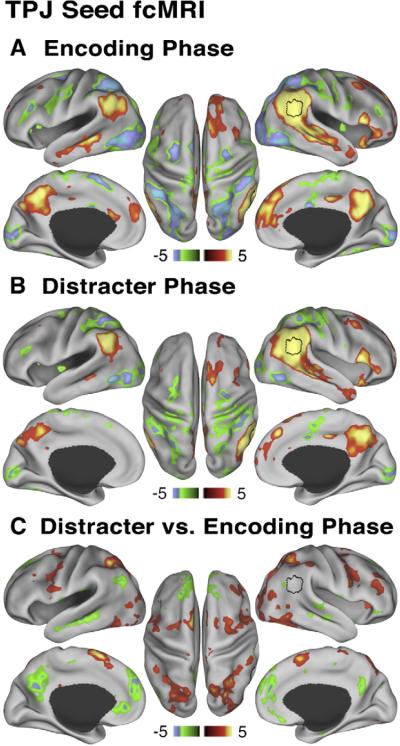
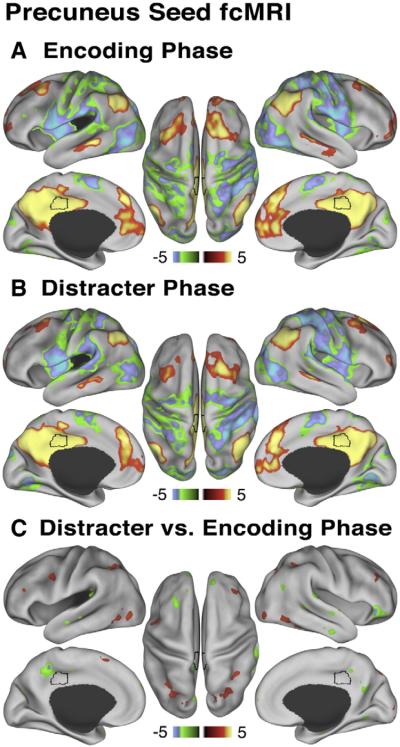
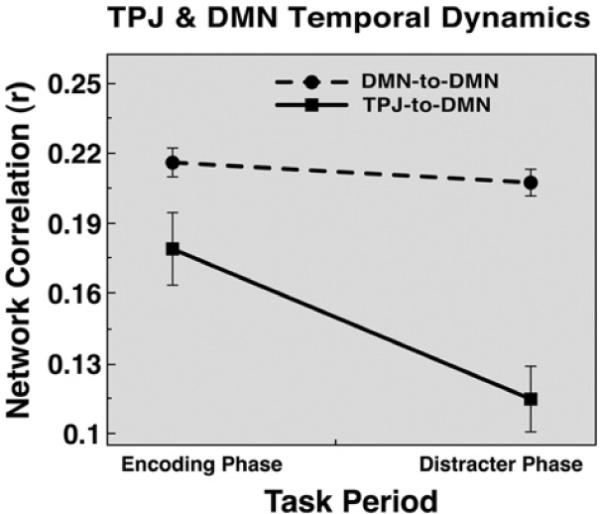
Previous work has shown that temporo-parietal junction (TPJ), part of a ventral attention network for stimulus-driven reorienting, deactivates during effortful cognitive engagement, along with the default mode network (DMN). TPJ deactivation has been reported both during working memory (WM) and rapid visual search, ostensibly to prevent reorienting to irrelevant objects. We tested whether the magnitude of this deactivation during WM encoding is predictive of subsequent WM performance. Using slow event-related fMRI and a delayed WM task in which distracter stimuli were presented during the maintenance phase, we found that greater TPJ and DMN deactivation during the encoding phase predicted better WM performance. TPJ and DMN, however, also showed several functional dissociations: (1) TPJ exhibited a different task-evoked pattern than DMN, responding to distracters sharing task-relevant features, but not to other types of distracters; and (2) TPJ showed strong functional connectivity with the DMN at encoding but not during distracter presentation. These results provide further evidence for the functional importance of TPJ suppression and indicate that TPJ and DMN deactivation is especially critical during WM trace formation. In addition, the functional connectivity results suggest that TPJ, while not part of the DMN during the resting state, may flexibly "couple" with this network depending on task demands.


Figures

Fig. 1
Fig. 1
Task design. A schematic representation of a single trial is shown along with different components and their onsets marked along the timeline. Each box represents a trial component with the duration marked bellow. First, subjects were presented with a set of complex geometric shapes, which they were instructed to memorize, followed by a delay. Next, during the middle phase of the trial subjects saw either: (1) an emotional distracter; (2) a task-related geometric shape distracter of a different color distinguishing it from the probe; (3) a neutral distracter; or (4) no distraction. This was followed by another delay. Finally, subjects were shown a probe for which they indicated using a button response if it was part of the memorized set or not.
Fig. 2
Fig. 2
Behavioral results. Mean accuracy (expressed as % correct) is shown for task-related, emotional, neutral distracter conditions as well as distracter-free trials across two load levels (high load Behavioral results. Mean accuracy (expressed as % correct) is shown for task-related, emotional, neutral distracter conditions as well as distracter-free trials across two load levels (high load=3 shapes, low load=2 shapes). Results are shown for the (A) fMRI sample only (N=21); and (B) full sample comprised of fMRI and an additional out-of-scanner sample (N=40). Both samples received identical versions of the task. Error bars represent ±1 standard error of the mean.
Fig. 3
Fig. 3
TPJ time courses. (A) TPJ ROI is shown on the right lateral surface rendering along with foci from previous studies. (B) Average event-related time course is shown for the TPJ ROI averaged across distracter types and loads, given no differences at encoding. (C) Average time course extracted from TPJ ROI is shown for correct (green) and incorrect (red-dotted) trials collapsed across loads and distracter types. Distracter onset is marked by a dotted vertical line ending in an arrow. Encoding and distracter phases are marked with grey bars. Error bars represent ±1 standard error of the mean.
Fig. 4
Fig. 4
Other regions showing less signal for correct than incorrect trials during encoding. (A) Regions showing less signal for correct than incorrect trials during the encoding phase closely match the Fox and colleagues (2005) default network regions, which are shown using black border outlines. Here, we show the foci using a Z>2.5 threshold demonstrating that even with a lower cutoff the deactivations are centered mainly around the default network regions and not elsewhere. (B) Average event-related time courses are shown for correct (green) and incorrect (red) trials across all the peak ROIs identified from the map in the top panel after it was corrected for multiple comparisons using cluster size algorithms to ensure whole-brain false positive rates of p<0.05. Each line represents signal for a single ROI averaged across all trial types given no differences between them during encoding. The black lines show the average response across all peak ROIs for correct (solid) and incorrect (dotted) trials. Distracter onset is marked by a dotted vertical line ending in an arrow. Encoding and distracter phases are marked with grey bars.
Fig. 5
Fig. 5
TPJ and default network distracter response. Magnitudes associated with the distracter response component obtained using the assumed GLM are shown for the TPJ (gray bars) and default network (DMN) (white bars) across different distracter types. Magnitudes are collapsed across loads given no differences as a function of load. Error bars represent ± 1 standard error of the mean.
Fig. 6
Fig. 6
Relationship between TPJ and default network at encoding and distracter phases. All maps are shown using Z statistics. (A) During the encoding phase TPJ seed ROI shows positive correlations (red-yellow colors) with main nodes of the default network and negative correlations (green-blue colors) with main components of the dorsal task network. (B) During the distracter phase the pattern is similar, but attenuated. (C) Maps show results of a paired t-test comparing TPJ ROI trial-based connectivity during distracter vs. encoding phase. Red-yellow map shows regions where correlations with the TPJ seed increased from encoding to distracter phase, whereas the green-blue map shows regions where correlations with the TPJ seed decreased from encoding to distracter phase, indicative of “de-coupling”. We show the map at Z>2.5 to illustrate that the TPJ (shown in black border outline) “de-couples” mainly from the default network and not other cortical regions, but `couples' more strongly with the dorsal task network. All peaks shown were present after applying a multiple comparison correction using cluster size algorithms to ensure whole-brain false positive rates of p<0.05.
Fig. 7
Fig. 7
Relationship between precuneus and default network at encoding and distracter phases. All maps are shown using Z statistics. Here we used an independent precuneus seed to demonstrate that: (A) During the encoding phase precuneus shows positive correlations (red-yellow colors) with the rest of the default network and negative correlations (green-blue colors) with the dorsal task network, analogous to the TPJ connectivity map at encoding. (B) During the distracter phase the pattern is largely similar. (C) Maps show results of a paired t-test comparing precuneus seed trial-based connectivity during distracter vs. encoding phase. Red-yellow maps shows regions where correlations with the precuneus seed increased from encoding to distracter phase, whereas the green-blue map shows regions where correlations with the precuneus seed decreased from encoding to distracter phase. As before, we show the map at Z>2.5 threshold to indicate that, in contrast to TPJ, a canonical default system node does not show such “de-coupling,” also illustrated quantitatively for the entire DMN in Fig. 8.
Fig. 8
Fig. 8
TPJ and default network functional connectivity temporal dynamics. Seed-based pairwise correlations are shown averaged across all TPJ-to-DMN correlations (i.e. TPJ and each DMN node, solid line with squares) and all DMN-to-DMN correlations (i.e. each DMN node with every other DMN node, dotted line with circles). The correlations are shown at encoding and distracter phases. Overall, DMN-to-DMN connections remain stable across the WM phases, while TPJ-to-DMN functional connectivity “weakens” from encoding to distracter phase. Error bars represent ± 1 standard error of the mean.

Similar articles

Cited by

References

    1. Antrobus J. Dreaming: cognitive processes during cortical activation ad high afferent thresholds. Psychol. Rev. 1991;98:96–121. - PubMed
    1. Antrobus JS, Singer JL, Goldstein S, Fortgang M. Mindwandering and cognitive structure. Trans. N. Y. Acad. Sci. 1970;32:242–252. - PubMed
    1. Arrington CM, Carr TH, Mayer AR, Rao SM. Neural mechanisms of visual attention: object-based selection of a region in space. J. Cogn. Neurosci. 2000;12:106–117. - PubMed
    1. Attneave F, Arnoult MD. The quantitative study of shape and pattern perception. Psychol. Bull. 1956;53:452–471. - PubMed
    1. Boynton GM, Engel SA, Glover GH, Heeger DJ. Linear systems analysis of functional magnetic resonance imaging in human V1. J. Neurosci. 1996;16:4207–4221. - PMC - PubMed

Publication types

LinkOut - more resources