Multicenter Study
. 2010 Feb 1;49(3):2123-33.
doi: 10.1016/j.neuroimage.2009.11.006. Epub 2009 Nov 12.

Impact of scanner hardware and imaging protocol on image quality and compartment volume precision in the ADNI cohort

Affiliations
Multicenter Study

Impact of scanner hardware and imaging protocol on image quality and compartment volume precision in the ADNI cohort

Frithjof Kruggel et al. Neuroimage. .

Abstract

Morphometry of brain structures based on magnetic resonance imaging (MRI) data has become an important tool in neurobiology. Recent multicenter studies in neurodegenerative diseases raised the issue of the precision of volumetric measures, and their dependence on the scanner properties and imaging protocol. A large dataset consisting of 1073 MRI examinations in 843 subjects, acquired on 90 scanners at 58 sites, is analyzed here. A comprehensive set of image quality and content measures is used to describe the influence of the scanner hardware and imaging protocol on the variability of morphometric measures. Scanners equipped with array coils show a remarkable advantage over conventional coils in terms of image quality measures. The signal- and contrast-to-noise ratio in similar systems is equal or slightly better at 1.5 T than 3.0 T, while the white/grey matter tissue contrast is generally better on high-field systems. Repeated MRI investigations on the same scanner were available in 41 subjects, on different scanners in 172 subjects. The retest reliability of repeated volumetric measures under the same conditions was found as sufficient to track changes in longitudinal examinations in individual subjects. Using different acquisition conditions in the same subject, however, the variance of volumetric measures was up to 10 times greater. Two likely factors explaining this finding are scanner-dependent geometrical inaccuracies and differences in the white/grey matter tissue contrast.


Figures

Fig. 1
Fig. 1
Dependency of signal-to-noise ratio (SNR) on scanner hardware, sorted by median. Bars in this boxplot denote the median, boxes the 25%/75% quartiles, whiskers the minimum/maximum range. Rankings are shown on the right. Ties denote non-significant differences (p = 0.05). Refer to Table 1 for device parameters and a description of the subject sample.
Fig. 2
Fig. 2
Dependency of contrast-to-noise ratio (CNR) on scanner hardware, sorted by median. Bars in this boxplot denote the median, boxes the 25%/75% quartiles, whiskers the minimum/maximum range. Rankings are shown on the right. Ties denote non-significant differences (p = 0.05). Refer to Table 1 for device parameters and a description of the subject sample.
Fig. 3
Fig. 3
Dependency of mutual information (MI) on scanner hardware, sorted by median. Bars in this boxplot denote the median, boxes the 25%/75% quartiles, whiskers the minimum/maximum range. Rankings are shown on the right. Ties denote non-significant differences (p = 0.05). Refer to Table 1 for device parameters and a description of the subject sample.
Fig. 4
Fig. 4
White/grey matter contrast ratio (WGC) on scanner hardware, sorted by median. Bars in this boxplot denote the median, boxes the 25%/75% quartiles, whiskers the minimum/maximum range. Rankings are shown on the right. Ties denote non-significant differences (p = 0.05). Refer to Table 1 for device parameters and a description of the subject sample.
Fig. 5
Fig. 5
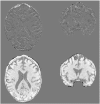
Axial (column 1) and coronal (column 2) sections of the same subject, examined on a Achieva PA 3.0T (top) and Excite PA 1.5T system (below). Columns 3 and 4 show the corresponding probability images of the GM class. A better WM/GM contrast on the Achieva system leads to a better delineation of the GM cortical layer.
Fig. 6
Fig. 6
Grey/white matter volume ratio vs. brain ratio for different scanner hardware. Solid ellipses correspond to the 2σ variance for repeated scans on the same scanner, dotted ellipses correspond to the 2σ variance on the same scanner hardware, pooled across sites. Refer to Table 4 for the number of sites and examinations per scanner type.
Fig. 7
Fig. 7
A subject was scanned twice on a Excite PA 1.5T system, and once on a Allegra HD 3.0T system. Data were linearly registered to a common reference and subtracted to yield the within-system difference (top), and the across-system difference (below). Note the much larger difference due to a different WM/GM contrast and the intense lines along compartment boundaries that indicate a system-related shift.

References

    1. Ashburner J, Friston KJ. Voxel-based morphometry—the methods. NeuroImage. 2000;11:805–821. - PubMed
    1. Baayen RH, Davidson DJ, Bates DM. Mixed-effects modeling with crossed random effects for subjects and items. J. Mem. Lang. 2008;59:390–412.
    1. Bishop CM. Neural networks for pattern recognition. Claredon Press; Oxford: 1995. p. 1995.
    1. Clarkson MJ, Ourselin S, Nielsen C, Leung KK, Barnes J, Whitwell JL, Gunter JL, Hill DL, Weiner MW, Jack CR, Fox NC. The Alzheimer's disease neuroimaging Initiative. Comparison of phantom and registration scaling corrections using the ADNI cohort. NeuroImage. 2009;47:1506–1513. - PMC - PubMed
    1. Ewers M, Teipel SJ, Dietrich O, Sch'onberg SO, Jessen F, Heun R, Scheltens P, van de Pold L, Freymann NR, Moeller HJ, Hampel H. Multicenter assessment of reliability of cranial MRI. Neurobiol. Aging. 2005;27:1051–1059. - PubMed

Publication types